-
Table of Contents
“The act of writing, it seems to me, makes up a shelter, allows space to what would otherwise be hidden.” – Meena Alexander
I will let this page serve as a place to find all written work on this blog organized from most to least recent:
Thinking Like An Activist (& Fixed Income Analyst)
Turbulent Valuations – Gogo Pitch
Managerial Case Study – Tom Murphy
Emirates Driving Company Pitch
Share Repurchases & The Shareholder
-
Turbulent Valuations.
I would like to share with you a business I particularly like and one that is part of my personal portfolio
Disclaimer: I do own shares of the company and have done since February, 2024. This is not investment advice or even education for that matter – just a window into my thinking.
-
Tom Murphy: The Minnow Who Swallowed a Whale
“The goal is not to have the longest train, but to arrive at the station first using the the least fuel.” – Tom Murphy
In William Thorndike’s The Outsiders, he takes you down the history of wonderful capital allocators from Singleton to Malone to Buffett. A name that often doesn’t get mentioned today is Thomas (Tom) Murphy, CEO of Capital Cities/ABC. Tom Murphy in my opinion is the best case study in capital allocation. He exhibited what I regard to be the most quintessential traits of a manager – he was bold, pragmatic, and thought independently. The combination of these traits led Cap Cities to be a 200-bagger (19.9% CAGR in 29 years) under Tom’s stewardship and proves the importance of capital allocation in stock price returns.
Background
Tom Murphy began his journey in media broadcasting working for his father’s friend, Frank Smith. He started at WTEN, a struggling TV station in Albany, New York with no experience in broadcasting. He was able to turn the previously bankrupt station into a cash generator through relentless focus on cost management & improving programming. In 1961, he hired Dan Burke to join in the company’s lean operating philosophy. Short after in 1966, Frank Smith passed away leaving Tom the CEO seat to occupy. He immediately made Dan Burke his COO and President.
“My job is to create free cash flow and his to spend it.” – Dan Burke
Upon taking the reigns as CEO, Tom began allocating the capital in opportunities he determined were attractive. In 1967 he bought KTRK (Houston ABC affiliate) the largest broadcast acquisition of the time. He followed up with acquisitions of Fairchild Communications (trade magazine publisher) and Triangle Communications. By the end of the initial spree Cap Cities owned 5 VHF TV stations, the maximum allowed by the FCC.
After hitting the FCC’s maximum threshold, Tom looked at adjacent industries for opportunities to allocate capital, ultimately, deciding on newspaper publishing. He became more active buying the Kansas City Star & Forth Worth Telegram (in ’74 and ’77). During the period of the mid-70s to early 80s Tom also noticed opportunities closer to home and began repurchasing shares of Cap Cities. During the protracted bear market he bought ~50% of shares in Cap Cities – mostly at single-digit multiples on earnings.
In the mid to late 80s, Tom Murphy cemented his name in history with the monstrous acquisition of ABC for $3.5bn in 1986. Like a true opportunist, this acquisition came as the FCC relaxed their ruling on station ownership. Afterwards, Burke went straight to working improving operations which resulted in a 2,000 bps increase in EBIT margins. This was Cap Cities last major acquisition as Tom refocused the company back to repurchasing & smaller sized acquisition integrations.
In 1995, Cap Cities/ABC was sold to Disney at a multiple of 13.5x cash flow or 28x earnings with the assistance of Warren Buffett (a key financier of the ABC deal in ’86).
“We just kept opportunistically buying assets, intelligently, leveraging the company, improving operations and then we’d take a bite of something else.” – Tom Murphy
Lessons of the Tale:
Pragmatism
It is too easy to be bound by strategy or ideology. What separates average managers from outsider CEOs is their ability to depart from strategy when an opportunity is too good to pass on. For example, the share repurchases under Murphy totaled to $1.8B+. This would’ve been Tom’s 2nd largest acquisition, behind ABC. His pragmatism is best showed around his acquisition based on FCC rulings. Once he had hit the maximum 5 stations in the 70s he bought elsewhere (his stock included). Once those rulings were relaxed he didn’t hesitate to go right back to the stations with the ABC purchase as he had conviction his lieutenant, Burke, was capable of turning the business around.
Independence
Unlike peers, Tom adopted what he thought to be the best strategy to increase the long-term value per share of Cap Cities. He did not follow the playbook of paying dividends, diversifying the business, or issuing shares. Instead, he decided to use leverage (which he paid down in advance), repurchased shares opportunistically, and bet big. He had kept himself solely responsible for acquisition decisions – no bankers whatsoever. When you consider research that claims ~70% of all acquisition destroy value and 1/2 of all acquisitions are reversed within 10 years. Tom Murphy’s skill at acquiring companies had become one of Cap Cities competitive advantages. He realized early on that TV stations placed #1 in local news got the lion’s share of advertising revenue. As such, he dismissed his frugality to procure the best talent in news, ensuring nearly all stations led in their local markets.
Boldness
Murphy’s boldness is best portrayed by some of the biggest capital allocation decisions he made. Under his stewardship Cap Cities acquired 3 businesses for 25%+ of their market cap – in the ABC acquisition, he used 100% of Cap Cities enterprise value. His boldness coupled with patience proved to be the asset for Cap Cities. He remarked that his pay was not on making deals, but to make good deals. The standard CEO does not always have this level of patience, instead looking to grow the size of the company at all costs. It takes boldness to stand alone idle, but, it is in these moments you can separate above-average allocators from the pack.
Takeaways
Tom Murphy & Dan Burke were able to generate returns far in excess of the market over a period of ~30 years. This was done using the combination of appropriately sized high conviction bets and the cultivation of a decentralized culture at Cap Cities. Despite their lack of experience coming into the broadcast industry they realized very early on what really mattered to achieve success. It is a common mistake to equate management’s capabilities with experience but like other outsider CEOs we see with Tom Murphy that is not really the case.
-
Multiples…
“There is no such thing as a bad asset, just bad prices.” – Howard Marks
“Crisply put, you want low P/E stocks that are also high quality and growing, with a high degree of certainty about the long-term outlook.” – Joel Tillinghast
According to corporate finance theory, the value of a cash generative asset is equal to the present value of future cash flows discounted back using some appropriate discount rate. Yet, in stock markets valuation is commonly reduced to multiples of some form of business earnings. But, what is in a multiple?
I define multiples as the general consensus of what market participants are willing to pay for a given company’s earnings. I believe John Huber (PM @ Saber Capital) put it best: “Some businesses are worth more, most are worth less.” So, what exactly determines whether a business should trade a higher multiple than another? It should really boil down to three main things: (1) Earning Growth Rates (2) Returns on Capital (3) Discount Rates.
3 Factors
You would expect a company with higher growth prospects to have a richer multiple than another, all else being equal. This is simply because the growing company will produce more cash flows in the future. Growth alone does not justify a higher multiple if the ROIIC is less than the WACC. Growth is wealth destructive if the incremental return on investments are lower than the cost of capital. For this reason, both of these factors are also pivotal in determining an appropriate multiple for a business.
When I speak to my friends about this topic (yes, we do discuss what influences multiples in our free time) an answer that pops up is a multiple sourced from the reciprocal of the cash flow growth rate minus the discount rate. This may sound familiar because that is simply just the Gordon Growth Model. The Gordon Growth Model spits out some multiple – some people forget this. To best illustrate, if given a P/E multiple and told that earnings are equal to distributable cash flow and would grow at 2% into perpetuity with a cost of capital equal to 10%, the multiple on a $1 of earnings earned should be 12.5x (1/(0.10-0.02)). Even when creating valuation models, people are too quick to forget that an exit multiple is still equivalent to some Gordon Growth assumptions.
Market Expectations
In the event all else is equal, lower multiples is a reflection of low market expectations of the ability of the business to create value in the future. If a business has a durable competitive position and is able to earn returns on capital in excess of the cost of capital, the business trading at low multiples will deliver high rates of return. So, what influences market expectations on businesses? There is probably a long list but those should include earnings cyclicality, competitive pressures, cost structures, and of course sentiment. Yet, everyone agrees that no two businesses are truly alike. So how does one reconcile the practice of comparable valuation based on industry?
In my opinion, it makes little sense to decide whether a business is cheap or not relative to peers in the industry unless they share similar economic characteristics. Although companies operate in the same industry, their business economics can be fundamentally different. For example, in semiconductor manufacturing it would be inane to expect TSMC to trade at similar multiples to a GlobalFoundries. One of these businesses has gross margins of 32% versus 55% for the other. One is the only seller of leading edge chips to customers with the largest balance sheets in the world, while the other competes with state funded enterprises and TSMC’s older fabs. As you can see despite operating in exactly the same industry, these two businesses economically are not similar. You can also factor in other risks in the, such as the geopolitical tensions one of the businesses faces versus the other.
An example on the flipside would be Cadence versus Synonpys. The pair sell software (electric design automation tools) to chip designers on a recurring basis. They are the only two companies able to produce software at the leading edge capable for design & verification. They do have some difference in terms of how deep they are ingrained into SD&A (though, following the acquisition of Ansys, this gap may close). For all intents and purposes, these two companies are what you can argue to be comparable. They make cash flow in the same model, same industry, and roughly have the same cost structure – one could even argue the future prospects mirror one another.
Multiples & Investment Returns
“If a business earns 18% on capital over 20 or 30 years, even if you pay an expensive looking price, you’ll end up with a fine result.” – Charlie Munger
The above quote from Charlie Munger typifies the importance of ROIC in value creation. Like all good things, some people tend to take it too far. When Munger references an expensive looking price it is not a triple-digit multiple on earnings because of rosy expectations on growth. But instead, companies that trade slight premiums to the market. Not all excellent businesses make good investments, price is a necessary component in stock price returns. In a Bernstein Research Report (42yr database), it was identified that 80%+ of all 10-baggers (90% for tech) were profitable to begin, had a median EBIT margin of 8-9%, and traded modestly below market levels (14-17x P/FE & 2x sales). Though you would’ve made good returns at higher multiples, one of the key drivers noted was multiple expansion along with solid revenue growth and margin improvement. Multiples are not the only function to explain investment returns but they are the only one an investor can control (assuming a small stake in the business). You must pay a multiple that enables your other expectations to be wrong – without this, you risk permanent impairment of capital.
To wrap up, I thought it’d be best to look at both the upside & downside of buying companies that have their multiples rerated. If you were reasonable and bought shares for 12x earnings and the market rerated multiples a decade later to 18x earnings, on the rerate alone you would’ve earned a 4% CAGR over 10 years. I made the simplifying assumption of no growth in that time – once you consider the effects of growth in sales and margin you begin to see how over long periods of time excellent businesses can become excellent investments if the price paid is appropriate. On the other hand, had the business rerated lower to 6x earnings you’d face a headwind of a -6.7% CAGR due to paying too high a multiple.
Multiples can change for all kinds of reasons, sometimes a perennially low one enables share cannibals to reduce share count dramatically (e.g., NVR, Autozone, etc…). To really juice up investment results you’d ideally find companies with durable competitive advantages trading at prices below your assumption of fair value, this protects downside risk should your assessment of the future prospects of the business prove to be incorrect.
-
Operating Leverage & Margins
Operating leverage refers to the degree of which a change in revenue corresponds to a change in operating income (EBIT). Should a business grow revenues 10% in a year but experience EBIT growth of 20%, it would be a plausible conclusion to assume the business exhibits high operating leverage. Operating leverage arises when fixed costs dominate the total cost structure – meaning there is little to no incremental costs related to sales growth.
You can also see operating leverage in the form of preproduction costs. To provide products and services there is almost always some form of cash outlays beforehand. These outlays have the effect of reducing operating margins before recognition of sales, which will eventually lead to higher EBIT margins down the line.
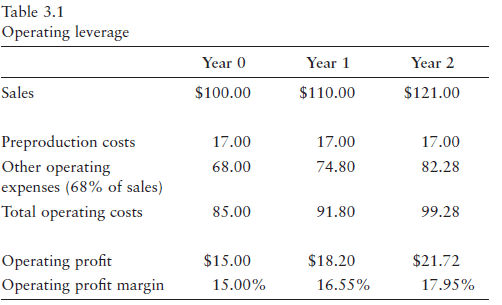
Source: Expectations Investing, Michael Mauboussin & Alfred Rappaport In Michael Mauboussin’s book, Expectations Investing, he explains that the timing and magnitude of these costs differ by business. Industries that rely on physical capital need these costs to sustain their growth at some desired capacity level. While companies that rely ‘knowledge assets’ will put these costs in the form of R&D to protect themselves from future obsolescence.
Below are two examples of operating leverage that have been in my mind as of late.
Disney & Media:
I believe Disney’s (all of the studios, really) transformation into a streaming business is the most intriguing example of operating leverage. Before the proliferation of streaming, studios would put growing amounts of capital into the production of content assets. The studios would then go around to leverage this newly created asset to multiple vendors. That is they would sell/license the rights to theatres, then to hotels, airlines, DVDs, cable, broadcast TV, and for a time streaming platforms. At each step, selling the rights to these vendors was effectively 100% margin. The costs were already expensed at the preproduction time – there is no need to rerecord a movie for that will be shown in a hotel versus on an airplane.
Streaming has caused studios to leave this highly profitable model with the hope of being winner the of the content aggregation race. To do so, studios have made some of the prized content exclusive to their platforms and forgone free EBIT dollars. The push to a direct-to-consumer model has destroyed all the different streams of income that were previously realized by the studios for their content. If you can watch the next Marvel movie as soon as it comes out on your phone, there will be no need for Disney to license the rights to all the vendors they once did, eliminating other profit opportunities. Streaming still has its share of operating leverage but not at the same level of the past model. There are other benefits to streaming some would point out. For one, it gives Disney direct access to the end-customers viewing experience – a marriage that has rarely if ever been achieved. With so much competition in the space, it remains to be seen how profitable the winners of the race will be and to what degree will consolidation play a role in both content & aggregation.
Marketplace Businesses:
Another place to find the effects of operating leverage is in businesses with two-sided network effects (e.g., Airbnb). These businesses will rely on marketing expenses early on in their life cycle to grow their user bases before turning into the de-facto marketplace (or network) for the services they provide. Since these businesses tend not to rely on variable costs as much, when their sales grow their marketing costs as a percent of revenue drops – as user base grows they need not spend on acquiring new users, the network itself becomes self sustaining.
Airbnb is one of the best examples of the effects of operating leverage on EBIT margins. In 2018 the company spent $1.1B on marketing & sales expenses on sales of $3.4B. The company was spending ~31% of sales to finance future customer acquisitions. In 2022, Airbnb then went on to spend $1.5B on marketing, but completed so on sales of $8.4B. That 30% figure has now dropped down to ~18%. For these types of businesses it doesn’t matter whether the gross booking value is $29B or $63B (as they were in 2018 & 2022 respectively), the costs do not change all that much at either amount. In that same time period the Airbnb’s EBIT margin went from <1% to 21.5% – an improvement of ~2,100 basis points.
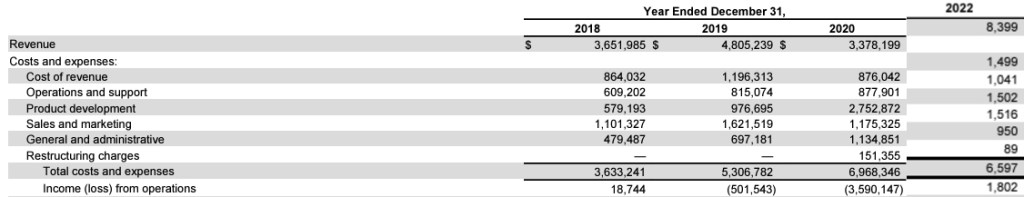
Source: Airbnb’s 2020 & 2022 Annual Reports Takeaway:
One of the easiest mistakes to make when evaluating businesses is to put too large an emphasis on historical information. As illustrated above it is possible that when evaluating a business the operating margins may have some downward pressure arising from these early stage costs. By considering the effects of operating leverage and the competitive position of the business you may come up with some informed estimate of what margins should look like in a normalized environment. After normalizing margins, you may then find that the business is far more attractive than at first glance.
Like investments, the best businesses are those that are able to generate more cash than invested into the business. Recognizing that a business has downward pressure on margins before the market is able to will put you in the position needed to capitalize on that future inflection point. It is all about finding where revisions in market expectations are needed – and a substantial change in EBIT margins will have a similar effect on business valuation.
-
Business Report: Taiwan Semiconductor Manufacturing Company (TSMC)
History
TSMC was founded by Morris Chang in 1987 through funding from the Taiwanese government, wealthy Taiwanese businessmen, and Phillips (retaining a 27.5% stake in exchange for production technology and IP licensing). Before its founding, Chang was previously an executive at Texas Instruments and had conjured the idea of a ‘pure play’ foundry. He had pitched the idea to other executives at TI and later Moore and Grove at Intel but ended up being rejected all the same. At the time there were no ‘fabless’ design companies, so it was seen as a gamble into a market that didn’t exist. It is now clear that Chang’s prescience has put TSMC at the forefront of semiconductor manufacturing.
Overview
TSMC’s market cap today is US$500 billion. The company has a 60% market share in the foundry business and an analyst estimated 90% market share in advanced logic manufacturing. TSMC is without a doubt one of the few companies with a durable competitive advantage evidenced by the stability of its market share over the years.

Fab Economics
TSMC categorizes their fabs into three types: mini, mega, and giga. Mini-fabs produce 10-25k wafers a month. Mega fabs produce 25k-100k wafers per month. Giga fabs produce greater than 100k wafers per month. Fabs are near identical regardless of classification; with giga-fabs simply being a scaled-up version of their counterparts.

The costs of building a fab have continued to rise through the years. In 2010 it cost TSMC ~$9.5 billion to build a 12-inch giga-fab in Taichung (Fab 15). Just 8 years later, Fab 18 (another 12-inch giga-fab based in Taiwan) would cost them ~$20 billion. Much of the increase in costs can be explained by elevated pricing of the machinery fabs house (e.g., photolithography machines). It is estimated that ASML’s new high-NA EUV technology will cost anywhere between $300-$400 million per system, a fee that limits potential customers to the very few with deep pockets.
Note: TSMC estimated in 2020 that they had 50% of all active EUV tools installed – putting them well ahead of their competitors. Some commentators estimate that in 2023 TSMC has 3x as many machines as Samsung (39) and 6x that of Intel (20).

Manufacturing semiconductors requires a focus on quality (yield), speed (cycle times), and volume (wafer shipments). TSMC has been able to optimize for all three. Cycle time refers to the number of days it takes to go through a mask layer (DPML) – where lower is better. In the 90s, a 180nm chip had about 25 layers and took 2 days to get through a layer. Appropriately, the full 25 layers would take 2 months. As processes improved so did the number of layers in a wafer. It is estimated that a 5nm chip would be 115 layers if not for EUV technology limiting it to the 81 layers it has today. If TSMC hadn’t improved cycle times it would take ~8 months to get through a wafer. The end-customers TSMC provides simply do not have the ability to wait long enough that long as technology constantly evolves. Delays are costly for manufacturers and their reputations.
Yields refer to the % of chips produced from a wafer versus the total number that could’ve been produced. Wafer shipments refer to the number of 12-inch wafer equivalents the company produces. There is a feedback loop between all 3 elements; as a foundry produces more chips (higher volume), they learn how to improve the process (better yields & speed) and can take on more and new business from customers (higher volumes).
Customers & Competition
TSMC has meaningful customer revenue concentration. Their top ten customers accounted for ~70% of their revenues in 2022, with their largest customer (Apple) accounting for 23%. I believe that the concentration of revenue within the top customers is not a business risk as conventionally thought of.
TSMC’s customer base gives the business an advantage against its competition. TSMC attracts the highest calibre customers in the chip design business (i.e., Apple, AMD, Nvidia, etc…). These companies order chips at high volumes and have the coffers deep enough to pay TSMC premium prices for said chips. The large swaths of volume ordered by top customers enable the TSMC machine to ramp-up production, learn from the ramp-up, and importantly, improve the yield on manufactured chips.
Differentiation
The linchpin of the TSMC foundry model is Chang’s promise (that has since been kept) that the business would not enter the chip design business. This promise has helped differentiate TSMC from its close competitor, Samsung. As TSMC refuses to design chips, companies such as Apple who directly compete with Samsung would rather send their designs over to TSMC.
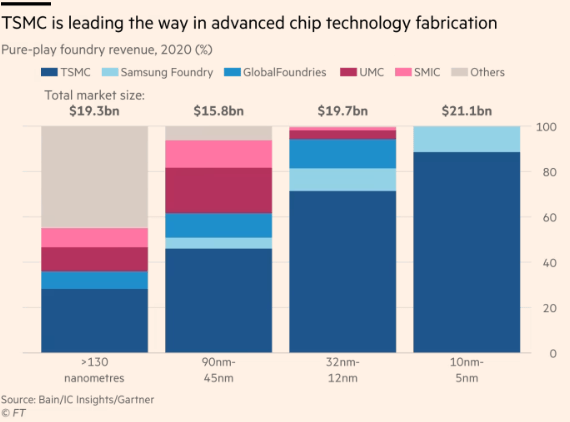
Alas, TSMC is still forced into sharing the stage with other foundries (i.e. Samsung). Chip designers would understandably prefer to not be held hostage to one manufacturer. This has led several customers to bifurcate their designs to Samsung and TSMC – the only two players at the leading edge (7nm processes and below) as of current. For non-leading edge processes, the market is more fragmented with other players (e.g., GlobalFoundries, SMIC, UMC, etc…) able to compete as the costs of entry are much lower than the advanced processes and research is far less intricate.
Moore’s Law
Before moving onto my investment thesis, I think it is most important to consider the history and possible death of Moore’s Law. Moore’s Law dictates that the number of transistors on an integrated circuit would double every two years and the cost of computing (to the consumer) would fall appropriately.
Today, there are several industry figures proclaiming the death of Moore’s Law. The most notable being Jensen Huang, the cofounder and CEO of Nvidia (although other industry leaders disagree, see Pat Gelsinger at Intel). The idea being that transistors cannot continue being shrunk and eventually the laws of physics will put an end to the shrinking. Additionally, it may end up being too costly to manufacture them before reaching such a point.

This is not the first time in history that Moore’s Law has been decreed as dead. In 1988 an expert at IBM, Erich Bloch, concluded that Moore’s Law would stop working once a transistor shrank to 1 micron (1000nm). Transistors would go onto be shrunk past that size a decade later. I think the correct answer to whether Moore’s Law is dead is a simple ‘who knows’. Irrespective of whether transistor density can continue to grow at some historical pace, TSMC is well positioned to extract value from the industry.
Thesis
Morris Chang credits Pat Haggerty for using the word pervasiveness to describe the semiconductor industry. If semiconductors are pervasive, no one company will be able to design all the products that use them. Washing machines will use them, automobiles, data centers, PCs, smartphones, and the technologies of the future all will too. The idea that enabled the success of the foundry business model still exists today. In an industry where the suppliers are concentrated and the buyers plentiful, it will be the suppliers that hold the key. In the semiconductor industry the keys are firmly placed in the pockets of the foundries, and at the leading edge – TSMC.
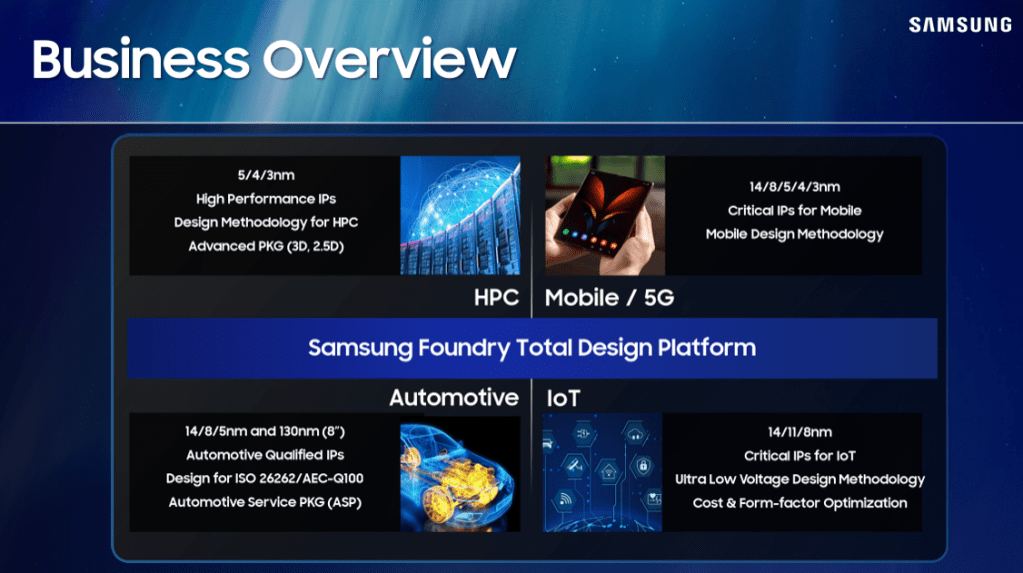
Processes and their use cases (per Samsung Foundry presentation) Financials
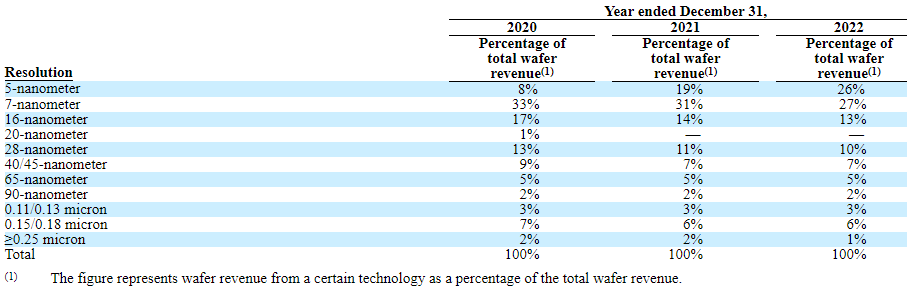
TSMC sells their chips to 5 different end customers, with the High Performance Computing (HPC) and Smartphone platforms accounting for ~80% of total revenues. Other platforms include automotive, digital consumer electronics, and the internet of things. HPC and smartphone platforms tend to require leading edge chips, which make up ~60% of TSMC’s revenues.
Over the past decade, TSMC has been able to grow FCF at a 25%+ CAGR and deliver a return on invested capital of ~20% in the same period. Although the business requires lots of capital expenditures, the return TSMC earns on those investments is remarkably high. If the reinvestment opportunities continue to present themselves at similar rates, it is a no-brainer for the company to continue making such value accretive investments.
Valuation
TSMC is expected to earn revenues of US$69 billion come the end of fiscal 2023 with operating margins of ~50%, with its largest expense being R&D – accounting for ~7% of total revenues. Although the semiconductor industry is known to be fraught with cyclicality, over the long-term, the logic business (leading edge logic at that) is largely secular with comfortable growth. TSMC’s current EV/EBIT multiple is 13x.
However, I believe that multiples is not truly reflective of the underlying earnings power of the business. I suspect the business has underearned in the three-quarters of the trailing twelve months, resetting from the pandemic boom. In a more normalized environment I fail to see why EBIT cannot be normalized at FY2022 #s implying a normalized EV/EBIT of 11x.
I expect that TSMC will be able to grow its revenues at 10%+ per annum for the next half-decade and keep operating margins at 45% or higher. Add in the AI tailwind and I think there’s lot of potential in growth the market is not currently pricing in. Should the business be valued at its current multiple or revert higher to historic levels (~15x EV/EBIT) in 5 years I would expect a minimum 10% CAGR at current prices of $95 per-share.
Risks
The biggest risk TSMC is exposed to is geopolitics. The CCP continues to state the reunification of Taiwan and the mainland as one of its goals. The majority of TSMC’s fabs are located on the island – any disruption to operations from a conflict will be a negative for the company. In my view, the recent US push of onshoring and protectionism will only increase this risk. The less dependent China is on TSMC and the reminder of the chip industry, the less care would be taken of TSMC’s fabs should a conflict arise.
As TSMC looks to diversify its fab locations away from Taiwan, the company will lose some of the competitive advantages it has. Just recently TSMC had to push the expected production timeline of its in-construction Arizona fab to 2025 due to a shortage of workers. Construction costs in the US are also ~5x that of Taiwan. The further the distance between fabs, the more friction there is, should problems arise (TSMC employees would have to fly across the Pacific rather than a trip to Japan, Korea, or a drive to the next fab). In Taiwan, the company could reliably recruit from the top universities and had a reliable supply chain at far less the cost. International diversification and labor standards will surely eat away at these advantages.

Lastly, in such a fast-paced industry, innovation from competitors will remain a risk TSMC is exposed to. Should TSMC be unable to produce leading edge chips reliably and allow their current and future competitors (Samsung & Intel) to get the jump on them they will lose customers and their edge.
Mitigations
In the case of Chinese expansion, there is no mitigation. That decision is left to the CCP Politburo, specifically, Xi Jinping. The only way to get comfortable with that risk in my opinion is through position sizing. For some that may be 0% of a portfolio for others it could be 90%, although the former makes more sense.
I do not think it is likely that TSMC loses their innovative edge. As the leading edge continues to battle the laws of physics, new entrants (Intel) will have a long way to go before they can match TSMC in terms of innovation and manufacturing process power. TSMC is constantly learning with each new iteration of its advanced processes, newer entrants will have to learn how to produce and convince customers to leave trusted partners. As Jensen Huang put it “TSMC has learned to dance with 400 partners, Intel has always danced alone.”
I am a firm believer that the best businesses are those that are doing the same thing that was done years earlier. In TSMC’s case the business has not changed since it invented the idea of dedicated foundries in 1987. I do not believe it will change its model in the next decade either barring foreign intervention.
Disclaimer: I own shares of the company discussed above.
-
A Primer On: Railroads
The railroad industry is often ignored by investors for its lack of glamour. But when you ignore the narrative, you realize there is so much to learn. Not many industries can boast the operating margins the big railroads have been able to obtain over the past couple decades. I’ll attempt to tell the lengthy story of the North American freight railroad industry in this post.
History
With the passing of the Pacific Railroad Act in 1862, the US government along with Union Pacific and Central Pacific began building a railroad stretching from Sacramento to Omaha. In May 1869, the two companies met at Promontory Point, in the flatlands of Utah – marking the completion of the first transcontinental railroad.
In the late 19th-century, the railroads continued to garner greater control of transportation through consolidation. The power the railroads had led to lots of corruption in the industry and the government. The industry was rife with pools, malinvestment, and overcharging of customers. The favourable economics of the industry resulted in a number of speculative booms and inevitable busts.
Eventually, the government and the people had enough and regulation followed. In Munn v. Illinois (1877), the US Supreme Court ruled that state governments could regulate private industries deemed necessary for the ‘common good’. The ruling was later overruled in the Wabash case, where the Supreme Court found that states could not regulate interstate commerce. Down the line, the Interstate Commerce Act (1887) set up the Interstate Commerce Commission (ICC) as an attempt for the government to begin regulating business in the United States; ensuring railroads charged fair prices. The ICC although not completely effective did mark the beginning of the end of railroad dominance – a decade of industry decline would follow.
Theodore Roosevelt’s administration would eventually mark the end of railroad dominance in the country. The Hepburn Act passed in 1906, gave the ICC the power to regulate the maximum shipping rates. It was not unheard of at that time to set the shipping rates well below what it cost the railroads to operate. The Roosevelt administration would also bring suits against a number of big businesses at the time, earning Theodore Roosevelt the moniker ‘trust-buster’. Effective regulation would put the railroad industry into comatose for near the remainder of the century.
Revival
In 1980, with the passing of the Staggers Act, the railroads were once again free from the shackles of regulation. The Staggers Act largely allowed for the railroads to determine their own prices to compete with new modes of transport. The ICC was abolished in 1996 and has been replaced with the Surface Transport Board (STB), who are know responsible for regulation should the shippers feel hard done by. Deregulation has resuscitated the once dominant industry and the railroads have been able to invest into their operations as they see fit. Following the malaise of the 20th-century, the rails have become far more consolidated and focused on operational efficiencies and continue to be today.
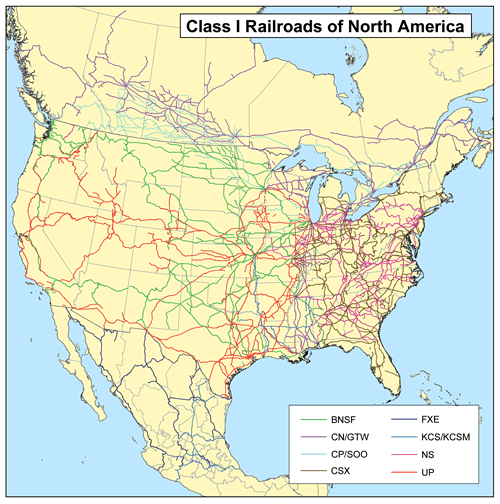
Big Players:
In the United States & Canada there are 6 Class 1 railroads (defined as having greater than $1B in operating revenues – adjusted for inflation yearly). The big players are broken down as follows:
Western USA: (1) Burlington Northern Santa Fe, aka BNSF (2) Union Pacific, aka UNP
Eastern USA: (3) CSX (4) Norfolk Southern, aka NS
Canadian Rails (5) Canadian National, aka CN (6) Canadian Pacific Kansas City Southern, aka CPKC
Together, the big six make up 95% of rail revenues and 75% of rail volumes.
The Assets
The rail companies are comprised of three major assets: tracks, locomotives, and railcars. The locomotives for a freight rail are often north of $3 million. While getting the right or ownership to build new tracks is nigh on impossible, if obtained, it can cost more than $1 million to build a mile of new tracks in the United States. Locomotives and railcars have useful lives well over 30 years and the land owned by railroads typically includes some amount either side of the tracks. It is all but impossible for an upstart to compete in this industry. I would go as far as saying North American rails have the largest barrier to entry of any industry, that has not been granted by their state(s).
The useful life of some of these assets also results in higher earning-to-cash conversion numbers. There is still meaningful capital expenditures required for rail maintenance but there is no need for the rails to be spending an arm and a leg for it.
Cartel-Like Economics
The big 6 Class railroads along with Ferromex (largest railroad operator in Mexico) are the parent organizations of a unique company, TTX Transportation. TTX is an off balance-sheet entity that offers railcar services to these companies, such as taking care of the railcars they leave at a destination. TTX is funded by outside investor debt, that is all but guaranteed by the big railroads. The entire purpose of TTX is to increase the margins of their parent organizations. This sounds a little like collusion to me…
Revenues
There are three main revenue sources for freight companies in North America. The three sources of revenues are as follows: bulk materials, industrial, and intermodal. The industrials segment includes plastics, metals, and ores. Bulk materials consist of grains fertilizers, and coals. The intermodal segment is the only real ‘growth’ segment and refers to the movement of containers from ships, rails, and trucks without removing content within the container. Intermodal revenues have grown in volume far more than other segments but remain a lower margin business. The revenue mix varies by company and is dependent on the geographies the tracks of the rails are located.
Precision Scheduled Railroading (PSR)
Starting in the 90s, the way rails were ran changed under Hunter Harrison (then CEO at Illinois Central) when he introduced PSR (it was really done on a large scale at CN by Harrison). PSR was a shift towards efficiency, simplifying routing networks, and improving operations. PSR moved trains into fixed schedules (similar to passenger trains), with fewer stops, less people, and longer trains – in the name of fuel-efficiency. Through PSR, the industry has moved away from unit trains (where all cars carry the same commodity) to diverse cargo being transported as needed. In the name of efficiency, PSR (& a focus on operations) has led to headcount reductions across the industry. As per the BLS, employment in the rail industry has gone from 500k (in 1980) to ~150k today.
There has been a lot of pushback to PSR from politicians, shippers, workers, and regulators. Shippers argue regulators need to do more to protect them from fees the rails charge for being off schedule. With the exception of BNSF, the Class 1 railroads have all switched to PSR. In 2019, BNSF’s Executive Chairman, Matt Rose, argued that by switching to PSR, the rails were only inviting regulatory risk – implying the margin improvement was not worth it in the long run.
There are also arguments that PSR’s cost reduction focus has contributed to inefficient safety procedures. At some rails, mechanical staff (responsible for checking on the state of the trains) have been cut and their work has been handed over to conductors – who are already slim in number. Although, it should be noted that the number of train derailments peaked in 70s and has been on a decline ever since.
Competition
The closest competition to the rails are trucks, if you would consider them as such. Rail shipping is far more cost-effective, sustainable, and speed-efficient. For all the reasons above, it simply makes the most sense for industrial economy to focus on rail transport. The location of freight customers also tends to make them captive to the railroad operating beside them, as it would not be economically feasible to use any other mode of transport. The result of this, is better economics for the railroads and returns for the shareholder.
Capital Allocation & Returns
Although I have waxed lyrical about the competitive position of the big rails, they all still share one similarity – a relatively low return on invested capital. Despite being the most effective form of transport, rails do just require a lot of capital expenditures (even when minimal).
In the past two decades, there has been a focus on the shareholder at the rails. Recognizing their competitive barriers, the companies have taken on more debt to finance dividends & buybacks. The stability of their cash flows has made the decision that bit easier, returning 40%+ of free cash flow to shareholders.
In sum, using their century old barriers to entry, the railroad business looks to be economically attractive. There is decent earnings visibility, captive customers, and the ability to take on debt comfortably. This has led to railroads providing outsized returns for their shareholders through capital allocation strategies & improved operations in recent history.
Asides
(1) The rail industry has a key figure – operating ratio (1-EBIT Margin), personally not sure why EBIT margin doesn’t suffice… (2) Union Pacific bought Central Pacific, through their Southern Pacific acquisition in 1996 (3) Hunter Harrison’s effect on the railroads can’t be understated, serving as CEO at CN, CP, and CSX (4) The industry has no shortage of activist investor history: Ackman at CSX, Elliot Management at CN, and Soroban at UNP (5) Rail landownership has led to a number of different businesses sprouting from within the railroad companies (ex: SPRINT).
(6) The Credit Mobilier scandal (1865-69, exposed in 72′) highlighted the extent of corruption in the Gilded Age. Credit Mobilier was believed to be a construction contractor for Union Pacific, but was truly controlled by UNP’s management. The plot was simple, to bill UNP at rates above reality and thus the government (at the time subsidized UNP rail construction). Credit Mobilier shares were given to politicians (from Congress to the sitting VP) in exchange for silence, receiving dividends for embezzling state funds. After being exposed, a number of politicians would leave their post and Union Pacific was left on the brink of bankruptcy.
-
The Emirates Driving Company
The Emirates Driving Company (EDC) is the exclusive provider of pre-license services in Abu Dhabi, a privilege the business has had since its inception, 23 years ago.
Licenses in the country work like so. Residents looking to obtain their first license must take part in theory classes, simulator training, and practical training at the EDC. However, there are a residents who are able to bypass the trainings, and the EDC completely, should they have a license from a foreign country (of a list of 43) that can be exchanged directly for an Emirati license. Residents who have licenses from other countries (that aren’t exchangeable on demand) can look at a new scheme by the roads & transport authority (RTA). This scheme allows for this group to have the opportunity of a one-time practical test by the licensing authority (in Abu Dhabi, that would be the police). Should one fail the one-time offered exam, then they must attend practical training at the EDC or other pre-licensing services in other parts of the country.
43 Exempted Countries:
I’ve attached a picture of the 43 exempted countries at the end of this post. Below is an image of the breakdown of the UAE’s population by nationality. What you’ll notice is that 8 of the largest foreign nationality groups in the country are unable to exchange their foreign licenses (should they have one) for an Emirati license.

Source: Global Markets Insight Geography
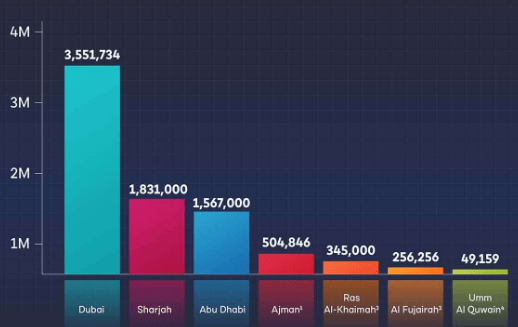
The United Arab Emirates (UAE) is comprised of 7 emirates, one being Abu Dhabi. Abu Dhabi is the 3rd largest emirate by population, behind Dubai & Sharjah. The population of the UAE is roughly 10 million, of which 85%+ are immigrant. The population of Abu Dhabi is ~1.5 million (compared to Dubai’s 3.5 million & Sharjah’s 1.8 million) with the immigrant population accounting for 80%+ of the population.
Source: Global Markets Insight Operations
The business has taken full advantage of its unique position and has been able to grow free cash flow at a 12% CAGR over the past 6 years, from AED 102 million to AED 200 million in the last fiscal year. The business commands impressive margins that have expanded in recent years. The gross margins are 80%, operating margins – 60%, and free cash flow margins – 57%. In 2017 the margins were 75%, 40%, and 42%.
In the space of six years, the operating margin has expanded by 2000 percentage points. If that is not sign of the operational capabilities of management, then I do not know what is.
Allocation
The management team has proven to be adept at operations and capital allocation. Their capital allocation strategy of choice has been to return cash to shareholders through dividends (payout ratio oscillates at around 50%). The country levies no income tax so shareholders get all the cash directly. There is no debt to pay down. There has been continued investment into the core business and no issuances of shares.
Digging into the past there was one specific act by the ‘previous’ management team I couldn’t help but admire. In 2019-20 they divested Qeyedah Driving – reducing their revenues, earnings, and overall size. In the 2019 annual report, they offered the details of the unit for the then past two years (see image below). The unit was returning a poor 5% on capital as of 2019. The decision to divest the unit informs me of a focus on value creation by the management team; an essential ingredient to long-term success for the continuing shareholder.

Source: 2019 Annual Report To add, the business has been able to report stellar returns on capital. In 2017, the business boasted a return on invested capital of 25% and a 16% return on equity capital. As of the end of 2022 the company’s ROIC was 48% and its ROE was 21%.
Valuation:
Today, the company trades for AED 26 per share or a market cap of AED 2.37 billion. The business has AED 562 million in cash on the balance sheet (or AED 6 per share) and an additional 111 million of financials assets. The absence of debt on the balance sheet gives the company an enterprise value of 1.8 billion. In the last fiscal year, the company earned 200 million in free cash flow – resulting in a EV/FCF of ~9 times. In other words, the business earns a free cash flow yield of 11% at current prices. Of which it pays AED 1 per share in dividends yearly – a cash return of 5%, ex-cash.
Absent growth – which has historically been at 12% – I would make my money back within 10 years. Assuming cash flows grow at 12%, I would make it back within 7 years.
Note – The conversion rate between an AED & the US dollar is fixed at $1 = AED3.6725.
Opportunities
I believe the future of the company will not be too dissimilar to its past. Recent revenue growth is 6% – as long as they can keep their moat, pricing power will not magically disappear and thus I expect the future to be more of the same.
I also expect a moderation in capital investment within the next three years. Recent capital expenditures have been unusually large due to the construction of a new facility in Abu Dhabi and a push to electrify their fleet. The push to electrify the fleet will be ongoing but the costs of construction are likely to finish this year. Reduced capital expenditures will free up extra cash that will be distributable to shareholders.
On the operational front, I expect more of the same when it comes to margins. The work that has been done to improve margins much like revenue I expect to be unchanging with minute improvements. In the company’s 2022 sustainability report they revealed that there has been an increase of 60% – as compared to the year prior – of the number of students who used the e-learning platform. Further digitization reduces frictional costs and improves the margins of the business.
The last opportunity that could make a real difference in creating shareholder value revolves around the company’s cash pile. There is just short of AED700 million of cash and financial assets on the balance sheet of which is AED562 million in cash – roughly a fourth of equity value. As per statements from the company’s management it seems they’ve been eyeing potential acquisitions and dividends as the potential use of this cash. They recently invested AED9.8 million into the Saudi-based Consultants Driving School in the form of convertible notes, it remains to be seen how this investment will unfold.
Premortem
To stimy optimism it makes sense to look at what could go wrong. I’ve listed a few of these possibilities down below:
- Liberalizing Policy – As mentioned earlier, there is a list of the 43 countries that are allowed to directly convert their issued licenses into Emirati licenses. This list was once 33 and even less before that. Should the list keep expanding and capture the countries that make up the majority of the immigrant population I don’t believe the business has the same level of attractiveness it once had.
- Tax Policy – Starting this year the country will introduce its first corporate tax policy. Businesses earning upwards of AED375,000 will be charged a 9% tax rate on the above amounts. Taxes reduce the cash available for shareholders and the start of this new tax policy will reduce the amount of cash that is distributable to the shareholder. Any further increases in the rate will have a negative effect on the continuing shareholder.
- Immigration – The country relies heavily on immigration to grow its population. Should a change in taste reduce the attractiveness of Abu Dhabi as a destination for foreigners, it becomes that bit harder to get consumers through the doors.
- The Far-Fetched – These last two are a bit far-fetched in terms of the timeline of which they could be realized. A shift into autonomous driving – should it mean ‘drivers’ require no licenses & the UAE (Abu Dhabi) revising their urban planning policies. Today, the country is very much reliant on personal vehicles and less so on public transport. On autonomous driving, I don’t know when the time will come for mass adoption let alone not requiring a license but should that day occur soon it will surely adversely affect the business.
Ownership Structure
Before concluding, I’ll add a bit on who owns the company. The International Holding Company is the largest shareholder with an indirect ownership stake of 48%. Their stake comes from their subsidiary, the Multiply Group, who directly owns an 11% stake in EDC and through their subsidiary, Spranza, they own an additional 37% stake in EDC. Other large shareholders own around 5-6% of the shares and are mostly investment funds. Major institutional ownership works out to around 70% of shares.
Conclusion
To briefly conclude, the company has been able to use its unique position as the exclusive provider of pre-license services in Abu Dhabi to improve the economics of the business through time. The business has 40% of its market cap in cash, steady but high margins, increasing returns on capital, and importantly trades at an 11% free cash flow yield. An easy to identify moat with proven durability has enabled the business to thrive the way it has in recent years and may just be the reason as to why it will continue to do so. They could also face worsening economics in the future from liberal policies, taxes, and more.
Note: Picture of the 43 exempted countries, per TheoryTest.AE

-
Discounting & Margins of Safety
The cost of equity as defined by Investopedia is “the rate of return an investor requires from an equity investment for it to be considered worth the risk”. The cost of equity is calculated as the sum of the risk free rate and the stock’s beta multiplied by the equity risk premium (see image below for the formula in full).

In valuing companies, you would typically use this formula along with the cost of debt to find the weighted average cost of capital, WACC. It is an immutable fact that the present value of a business is the future cash flows of said business discounted to today using an appropriate discount rate. The appropriate discount rate just so happens to be WACC in most cases.
I have a few problems with using WACC as a discount rate. I’ll explain why:
I am sure most people have heard that volatility is an ineffective measure of risk. I agree with this statement. I am of the opinion that the only way to measure business risk is to avoid numeration almost entirely. The only way to think of risk is to identify the innate risk of the business operations and the resulting probability of permanent capital impairment. To be succinct, I do not believe the cost of equity is of any use in discounting cash flows. Since all public equities have a positive current equity value, this means I cannot support a weighted average cost of capital either.
On the cost of debt…
Of the make up of WACC, the cost of debt is the more coherent of the two. It makes sense that all else held constant, incremental debt up to a point is beneficial to a firm’s value, as it decreases the WACC. This is because the interest payment on debt is tax deductible (avoiding taxes can be quite beneficial, just ask John Malone). But again, I don’t think the assigned cost of debt is all that useful in valuation. I’ll explain how I like to think of it down below:
Opportunity Cost
All economic decisions should be measured against ‘the next best alternative action’, the opportunity cost (as defined by the Core Economics textbook). The same textbook also defines the opportunity cost of capital to be: the amount of income an investor could have received by investing the unit of capital somewhere else. I think that is a perfect definition and the best way to think about discount rates. Every time you choose to deploy capital into a business or something else there is always the chance to refrain from doing so and just put it into a risk-free asset.
Add: When I mention risk-free rate (or asset) what I mean is the long-term yield on a government bond
I think the best measure of a discount rate is simply the prevailing risk free rate (or if abnormally low, an adjusted amount closer to the long-term average risk-free rate – being careful of attempting to predict future interest rates/yields…). By comparing the yields between your potential investment and the risk-free rate you are addressing the opportunity cost of capital. The investor should then be able to judge the margin of safety as the excess of a firm’s yield over that of the risk-free rate for the same length of time. I believe the surer the business the lower the excess on yield is needed is to be acted upon, the opposite holds. It is important to note that price paid per-share will undoubtedly have an impact on the return of the investment as it is the denominator of an earnings yield.
The reason terrific businesses can justify being bought at higher prices (consequently lower yields) is due to the durability of their earning power. Over the long-term, businesses that have durable advantages over competition will grow their earnings and yield. The best of businesses can justify narrower margins of safety but the examples of such businesses are far and few between.
Assumptions
I made a key assumption in writing this post that the investor is able to ‘confidently’ forecast future cash flows. If one is not confident of doing so, there is no point comparing the opportunity cost and they should just move on. Some would argue that you should adjust the discount rate higher to make up for the uncertainty or extra risk of the asset. This of course makes mathematical sense as it reduces the value of the uncertain future cash flows but not so much logical sense. The second you recognize your inability to ‘predict’ future cash flows should be where the operation stops.
An Important Reminder A second assumption I made was the nature of government bonds being ‘risk-free’. Obviously, this is not always the case and depends on the currency/country the business deals in. In the event, that a government bond in the currency of interest is not risk-free, the investor needs to decide on what should be the minimum yield on their investment.
To quickly conclude, an opportunity cost of capital is the best representative of a discount rate. The margin of safety arises as the earnings yield of the business exceeds the opportunity cost of capital and the businesses whose returns are buoyed up by durable advantages require less a difference than their counterparts.
-
Equity Report: Alphabet, Inc (NASDAQ: GOOGL)
In 1998, Larry Page & Sergey Brin founded Google. The company since then has grown to be one of the most valuable brands in the world. The company has lost roughly a fifth of its market value from its recent high due to fear of competition through AI disruption. Google is a company I’ve always admired and have now had the chance to dig into the business deeply and determine if there is any value.
Opportunity
Market sentiment around Google is not filled with the same confidence it had a year or two ago. The rise of OpenAI’s ChatGPT has had investors worried that Google’s impenetrable moat may no longer exist due to advances in AI and the emergence of Bing in companion with ChatGPT. Google shares have lost 10% of its value in the past year with volatility running rampant in that period. I believe that the company has not lost its moat and will continue to be the leader resoundingly in the search engine market. I believe Google’s entrance into the cloud has a long runway of growth. I believe the company will still be able to compound its earnings for long to come and reinvest a fair share of said earnings back into the business in the coming years whilst reducing share count through its repurchase program.
Introduction
Alphabet (Google), is one of the largest companies in the world and today trades at a $1.2 trillion market cap (enterprise value of $1.1 trillion). The business can be split business into 3 main segments: Google Advertising, Google Others, and Google Cloud. The majority of Google’s revenues come from its advertising business, specifically Search and Youtube, their owned properties, with Google Network Partners accounting for the remainder. Google Others consists of hardware products (ex: Nest & Pixel), non-advertising YouTube revenues, and Android/Play Store revenues. Lastly, Google Cloud, is comprised of Google Workspace (ex: collaboration enterprise tools) and Google Cloud Platform, its infrastructure and platform services – the company’s answer to Microsoft’s Azure & Amazon’s AWS. The Cloud platform is still relatively young and has much more revenue ahead in its future.
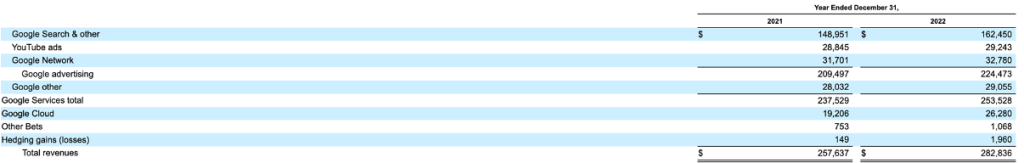
Breakdown in Percentage Terms: (1) Google Advertising – 80% (2) Google Others – 10% (3) Google Cloud – 10% Google’s Moat
Google’s advertising business accounts for 80% of total revenues ($224B). The advertising business is home to Google’s deepest moats. To explain the source of Google’s moat in online advertising it is important to recognize how the advertising auction markets work.
The advertising market works as follows. Each time a user visits a website the ad space on the site is routed onto the Ad Exchange. In the exchange, the ad space on the site is in real-time auctioned off to the highest bidder. By the time the auction concludes, the advertiser has their ads displayed to the user before they can notice anything has occurred. See image below for graphical representation of the process.

Source: Department of Justice Google’s key advantage in the auctioning markets is their control of intermediary tools used in ad inventory & the advertiser network, whilst maintaining control of the primary ad exchange used in the market. Google sells its own ad space as well as third party (Network Members) ad space on the exchange. The share of Google site revenues a a percentage of total revenue has been increasing over the past decade. This is a promising sign as the cost of revenue on Network member revenues is much higher than being effectively non-existent with their owned properties.
The main advantage realized by Google through the ecosystem they’ve built is a speed advantage. As both the exchange and intermediary tools (Google Ads & DV360) used to bid on ad space are located near one another. Advertisers will look towards Google as their intermediary of choice and the company take its share of the ad dollars.
In all, Google houses the largest publisher ad inventory (DoubleClick) which makes their intermediary tools and ad exchange far more valuable as well. Any potential entrants into the space will need to convince advertisers and/or publishers that their platform can outdo Google in speed or effectiveness in the bidding process – a near impossible task. Google is able to rely on network effects to widen their moat. This is best illustrated in ad bidding and through YouTube. The network attracts people to join and equally pulls them into staying on with Google. As the network grows the moat widens with each additional publisher.
Google’s Runway
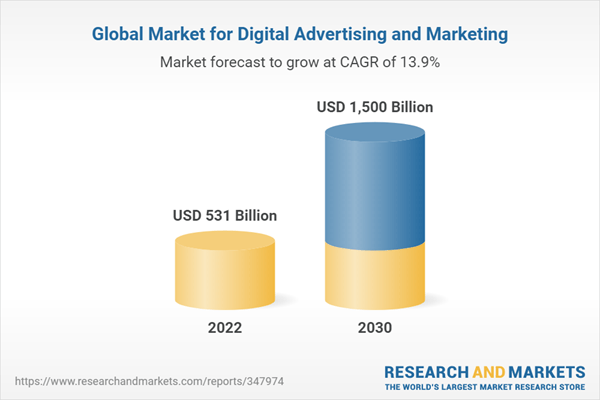
When looking at Google’s size one has to question the runway and just how much more can the company grow. I believe the company still has a sizeable runway in advertising and the cloud. The digital advertising market is expected grow at 14% over the next 8 years before amassing a size of $1.5 trillion. Google is placed well to continue to capture the growth in global market over the years through Search & YouTube. There will undoubtedly be more players in the advertising market as the likes of Amazon & TikTok grow in the market. The sheer size of the market however will still provide Google with a long runway in digital advertising.
The Cloud
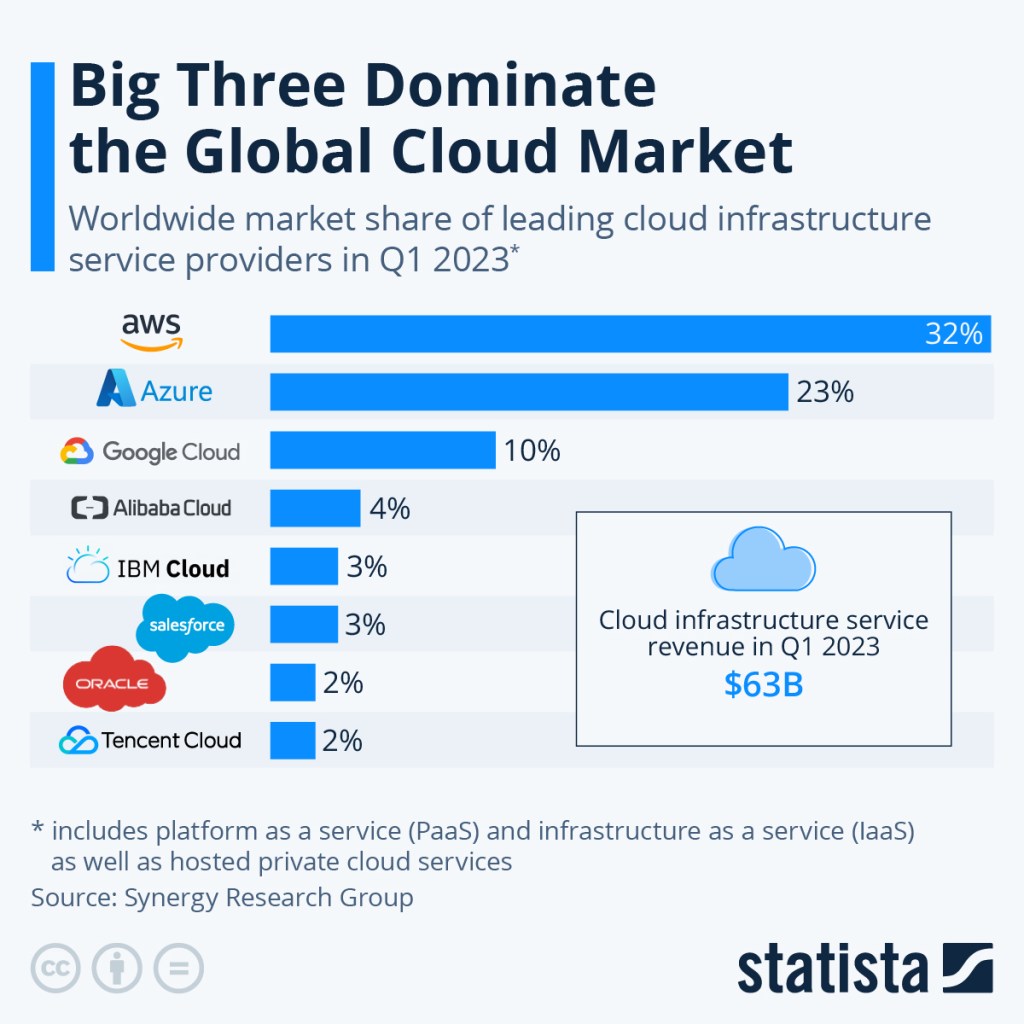
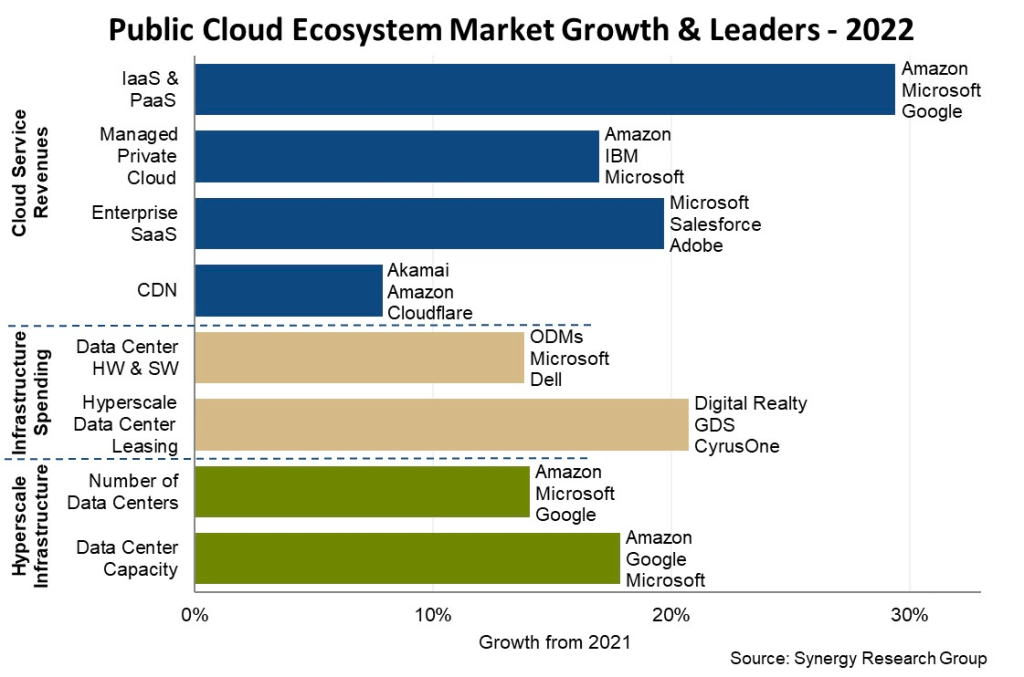
Google’s second opportunity to grow is in their cloud business. The company lags behind Microsoft and Amazon in this market but there is more than enough room for all businesses to continue growing their revenues for years to come. Over the past five years, Google Cloud has grown its market share from 7% to 11%, with only one down year. In that time revenue in the Cloud segment has shot up from $4 billion to $26 billion in 2022 (a 6x in 5 years!). I’ve also noticed a trend in the cloud infrastructure market; the hyperscalers (Google, Amazon, Microsoft) seem to be consolidating market share as the years go by. In 2017 their combined market share was 53% and just last year it was up to 66%. The cloud market has shown resilience over the past year growing at over 20% despite headwinds. The growth opportunity in cloud for Google cannot be understated and will definitely be a major revenue driver for the company in the years to come.
Source: Synergy Research Group Valuation
The company has a ROIIC (return on incremental invested capital) over the past ten years of 30%. In that time, the company has generated a cumulative $367 billion in operating earnings, increased their invested capital base by $206 billion, and increased operating earnings by $62 billion. I estimate that 56% of operating earnings is reinvested back into the business. I believe a company that can generate that level of return whilst reinvesting over half its operating earnings is the key to value creation for the continuing shareholder.
On its free cash flow generation, I’ve made a few adjustments to calculate a measure that I believe to be a more conservative and closer to reality measure of cash flow (owner earnings). I’ve calculated it to as operating cash flow plus fines less stock based compensation and the maintenance level of capital expenditures. In the ten years from 2012-2022, this measure has increased from $10 billion to $53 billion, a CAGR of 17%.
The company is currently trading for $104.50 per share, implying that we would be paying 18x earnings (net of cash) for a company that has delivered high returns on capital, steady margins, and a has a huge runway in its key business segments. There is still so much growth left to uncover that I think at the current price we get a fair deal for a terrific company.
As per my owner earnings calculation, in the year 2022, company generated about $53 billion in earnings which would imply an earnings yield (net of cash) of 4.23%. In comparison, the ten year treasury yields 3.48%. The difference between the two yields is slim and not a proper account of a large margin of safety which I believe is made up in the quality of the business and the attractive opportunities it has to deploy capital back in operations.
In my estimation, the company has loads of growth ahead of itself in cloud and advertising, loads of free cash flow generation and will continue to buyback is shares; making use of its enormous cash pile. I believe that the per share earnings of Google can grow to $7.50 per share in the next five years and still have a sizeable runway ahead of itself. Should the market provide a rerate on Google’s earnings back to 20x earnings (historically traded for mid 20s) after realizing that ChatGPT and other LLMs aren’t the value destructive threat they appear to be, we could be looking at a business worth in excess of $150/share. This represent a near 47% premium to current market prices. I expect Google to reach $7.50 in EPS by 2027FYE, representing a 12%+ IRR from current prices – fueled by share count reductions and earnings growth at high incremental margins.
Risk
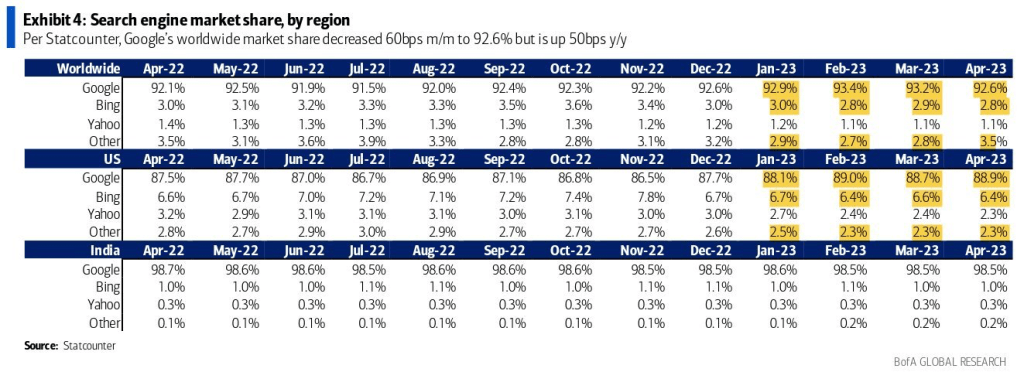
It is almost inappropriate nowadays to speak of Google without mentioning artificial intelligence. The general fear around Google is that their supremacy in search will come under fire as a result of developments in AI, specifically through Bing’s partnership with OpenAI/ChatGPT. While I do believe that AI will change the way we access information I am not of the belief that AI (AGI, specifically) chatbots will overcome Google Search’s dominance as the search engine of choice. Firstly, AI has always been here and improving Google’s advertising efforts and effectiveness in search. On that front, this is just the next step. I also believe that chatbots are not true disruptors to Search, but additions necessary to remain competitive. Recent data from Statcounter shows that YoY, Google’s market share actually grew, in spite of Bing integrating ChatGPT (their market share dropped) into the search engine.
I think when it comes to AI, it is important not to be too swept away by its perceived novelty. I believe that Google’s distribution ability and data puts the company in a position to remain the dominant player in the search engine market and integrate AI into the platform as needed. I struggle to see where a competitor can beat Google’s brand, data and distribution prowess on this front, perhaps a first-mover’s advantage may allow them to ‘win’ in the short term. However, in the long run Google is well positioned to maintain its dominance.
Summary
I find that neomania can be the enemy of the investor and I believe that is the case at Google today. The market has in the past few months let negative sentiment hinder its vision. Despite what commentators may think, Google does not resemble an AI lose to me, but, may actually be able to integrate appropriately and improve the returns on their ads business. If you were to look at the business over the next 3-5 years you will see that Google is in position to grow its earning power for the years to come. There will be short term challenges to keep its reputation and brand value but without doubt the economics of the business are favourable.
-
Share Repurchases & The Shareholder
In general, market participants have long lauded companies that repurchase their shares. I’ve always wondered whether such praise is warranted and to what extent is a share repurchase program beneficial to the continuing shareholder. In this post, I’ll attempt to go through the positives and the negatives of this tool in returning capital to shareholders. I’ll also make use of some examples of what I believe to be effective and ineffective share repurchases.
First, we must establish when a share repurchase should take place. Stock buybacks are typically, and correctly in my opinion, from the excess cash generated by a business. There are a few options management has when it comes to making use of shareholder cash. Some considerations I found: (1) do nothing – let it grow (2) expand operations organically (3) expand operations through acquisitions (4) pay down debts (5) issue a dividend to shareholders (6) repurchase the company’s shares. All other options have their pros and cons but let’s keep the focus of this post to stock buybacks.
The preeminent argument for the use of stock buybacks is its ability to boost a company’s per-share earnings. The earnings per-share, EPS, is the company’s true bottom line when it comes to evaluating an income statement. There are really only 3 ways to increase a company’s EPS: (1) revenue growth (2) cost cutting (3) share repurchases. Buybacks can often be the best option for companies given the buyback results in lower share count. Take for example, a company whose earnings remain flat from year to year is able to repurchase half its share count. This buyback would result in the EPS doubling in the space of year, a feat that would be extremely difficult to obtain through top line performance or cost cutting. Best of all, this opportunity can arise from nothing more than inefficient pricing by market participants. I concede that this example is a bit too Pollyannaish but it does a great job illustrating the attractiveness of buybacks. Management buying back shares at prices below a conservatively estimated intrinsic value is the best implementation of stock buybacks when no better alternatives exist with shareholder cash.
So what then is the argument against buybacks? Simply put, management does not always buy shares at truly enticing share prices – failing to deliver the desired share count decrease. A buyback is truly useless if the share based compensation within the company engulfs the retired share count – leaving no effect on the share count, or worse, an increase in the share count. Often, management compensation is tied with EPS targets providing the incentive to make use of buybacks. But as noted in the second paragraph, there are other options which make more sense for respective businesses. For instance, a business may be better off reinvesting cash given that it is able to earn a return above its cost of capital.
Let’s take a close look at two examples of stock buyback programs – the best and the worst of the tool in action in the past ten years (2013-2022).
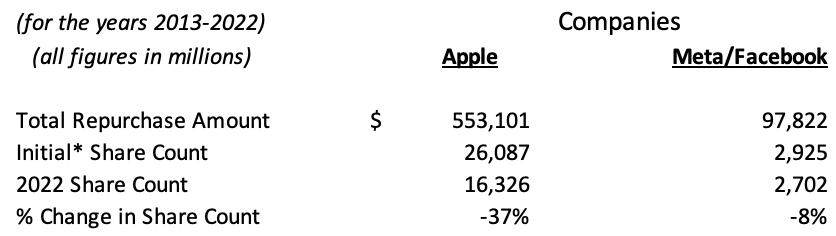
* – prior to year of 1st repurchase ending share count First, we should examine excellent use of repurchases, best demonstrated by Apple. The company began its share repurchase program back in 2013. Since then, the company has spent a cumulative $553 billion repurchasing its shares. The share count has dropped by 37% in this time – rewarding its continuing shareholders. When buybacks are used this way, it gives the continuing shareholder a larger interest in the company’s hopefully growing cash flows. In 2021, the average repurchase price was $149, today the shares trade at $148. In this case, the price paid seems to be a nonissue. Assuming there are no other opportunities to better the company’s intrinsic value, the buyback as performed by Apple serves as a prime example of effective returning of capital to the continuing shareholder.
Moving to the uglier share repurchase program is Meta, previously Facebook. In 2017, Meta began its share repurchase program. Since then, the company has spent a cumulative $98 billion repurchasing its shares. In that time, the share count has dropped a measly 8%. An even more exasperating fact is that the average price paid for these repurchases in 2021 was $330 per-share. Today, Meta trades at roughly $180 per-share (and no, there was no stock split), representing a 45% decline. During the year 2021, Meta seems to have been lighting shareholder cash on fire under the guise of a share repurchase program all the while rewarding their CFO, David Wehner, bonuses for what was adjudged to be excellent work. In fact, from the years 2017-2021 Meta’s share repurchases only reduced the share count by a miserable 1.2%. Alas, there is some light at the end of the tunnel at Meta. In 2022, as the market reacted to a host of news surrounding the company and the share price dropped precipitously, the buybacks didn’t stop – even dipping into debt for extra liquidity. Indeed, earlier this year the company increased its share repurchase authorisation by $40 billion.
The most obvious reason as to why Apple is able to retire more of its share count than Meta can be found in their respective cash flow statements. Meta since 2017 has accumulated $40 billion in share based compensation expenses. Apple, however, has accumulated $53 billion in share based compensation expenses since 2013. While boards & managements like to reward themselves with the company’s shares, it is imperative they remain mindful of the dilution from this compensation. Meta’s buybacks have seemingly been a tool for sterilization and not the benefit of their continuing shareholders. When a buyback is used to sterilize newly issued shares, like previously at Meta, it delivers nothing to the continuing shareholder.
The examples at Meta & Apple just go to show the importance of buying back stock at attractive prices while limiting the dilution from share based compensation. If management is able to do that, the continuing shareholder will benefit and see the intrinsic value per-share grow. As noted, most management is unable to act at value-accretive prices and the equity investor should consider this. When evaluating buyback programs, it is not the dollar amount that matters but the change in share count to ensure management acts in a way that benefits continuing shareholders.
-
Subscribe
Subscribed
Already have a WordPress.com account? Log in now.
