A Primer On: Railroads

The railroad industry is often ignored by investors for its lack of glamour. But when you ignore the narrative, you realize there is so much to learn. Not many industries can boast the operating margins the big railroads have been able to obtain over the past couple decades. I’ll attempt to tell the lengthy story of the North American freight railroad industry in this post.

History

With the passing of the Pacific Railroad Act in 1862, the US government along with Union Pacific and Central Pacific began building a railroad stretching from Sacramento to Omaha. In May 1869, the two companies met at Promontory Point, in the flatlands of Utah – marking the completion of the first transcontinental railroad.

In the late 19th-century, the railroads continued to garner greater control of transportation through consolidation. The power the railroads had led to lots of corruption in the industry and the government. The industry was rife with pools, malinvestment, and overcharging of customers. The favourable economics of the industry resulted in a number of speculative booms and inevitable busts.

Eventually, the government and the people had enough and regulation followed. In Munn v. Illinois (1877), the US Supreme Court ruled that state governments could regulate private industries deemed necessary for the ‘common good’. The ruling was later overruled in the Wabash case, where the Supreme Court found that states could not regulate interstate commerce. Down the line, the Interstate Commerce Act (1887) set up the Interstate Commerce Commission (ICC) as an attempt for the government to begin regulating business in the United States; ensuring railroads charged fair prices. The ICC although not completely effective did mark the beginning of the end of railroad dominance – a decade of industry decline would follow.

Theodore Roosevelt’s administration would eventually mark the end of railroad dominance in the country. The Hepburn Act passed in 1906, gave the ICC the power to regulate the maximum shipping rates. It was not unheard of at that time to set the shipping rates well below what it cost the railroads to operate. The Roosevelt administration would also bring suits against a number of big businesses at the time, earning Theodore Roosevelt the moniker ‘trust-buster’. Effective regulation would put the railroad industry into comatose for near the remainder of the century.

Revival

In 1980, with the passing of the Staggers Act, the railroads were once again free from the shackles of regulation. The Staggers Act largely allowed for the railroads to determine their own prices to compete with new modes of transport. The ICC was abolished in 1996 and has been replaced with the Surface Transport Board (STB), who are know responsible for regulation should the shippers feel hard done by. Deregulation has resuscitated the once dominant industry and the railroads have been able to invest into their operations as they see fit. Following the malaise of the 20th-century, the rails have become far more consolidated and focused on operational efficiencies and continue to be today.

Big Players:

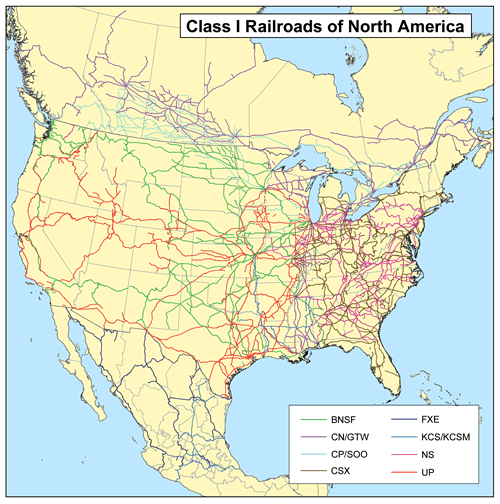
In the United States & Canada there are 6 Class 1 railroads (defined as having greater than $1B in operating revenues – adjusted for inflation yearly). The big players are broken down as follows:

Western USA: (1) Burlington Northern Santa Fe, aka BNSF (2) Union Pacific, aka UNP

Eastern USA: (3) CSX (4) Norfolk Southern, aka NS

Canadian Rails (5) Canadian National, aka CN (6) Canadian Pacific Kansas City Southern, aka CPKC

Together, the big six make up 95% of rail revenues and 75% of rail volumes.

The Assets

The rail companies are comprised of three major assets: tracks, locomotives, and railcars. The locomotives for a freight rail are often north of $3 million. While getting the right or ownership to build new tracks is nigh on impossible, if obtained, it can cost more than $1 million to build a mile of new tracks in the United States. Locomotives and railcars have useful lives well over 30 years and the land owned by railroads typically includes some amount either side of the tracks. It is all but impossible for an upstart to compete in this industry. I would go as far as saying North American rails have the largest barrier to entry of any industry, that has not been granted by their state(s).

The useful life of some of these assets also results in higher earning-to-cash conversion numbers. There is still meaningful capital expenditures required for rail maintenance but there is no need for the rails to be spending an arm and a leg for it.

Cartel-Like Economics

The big 6 Class railroads along with Ferromex (largest railroad operator in Mexico) are the parent organizations of a unique company, TTX Transportation. TTX is an off balance-sheet entity that offers railcar services to these companies, such as taking care of the railcars they leave at a destination. TTX is funded by outside investor debt, that is all but guaranteed by the big railroads. The entire purpose of TTX is to increase the margins of their parent organizations. This sounds a little like collusion to me…

Revenues

There are three main revenue sources for freight companies in North America. The three sources of revenues are as follows: bulk materials, industrial, and intermodal. The industrials segment includes plastics, metals, and ores. Bulk materials consist of grains fertilizers, and coals. The intermodal segment is the only real ‘growth’ segment and refers to the movement of containers from ships, rails, and trucks without removing content within the container. Intermodal revenues have grown in volume far more than other segments but remain a lower margin business. The revenue mix varies by company and is dependent on the geographies the tracks of the rails are located.

Precision Scheduled Railroading (PSR)

Starting in the 90s, the way rails were ran changed under Hunter Harrison (then CEO at Illinois Central) when he introduced PSR (it was really done on a large scale at CN by Harrison). PSR was a shift towards efficiency, simplifying routing networks, and improving operations. PSR moved trains into fixed schedules (similar to passenger trains), with fewer stops, less people, and longer trains – in the name of fuel-efficiency. Through PSR, the industry has moved away from unit trains (where all cars carry the same commodity) to diverse cargo being transported as needed. In the name of efficiency, PSR (& a focus on operations) has led to headcount reductions across the industry. As per the BLS, employment in the rail industry has gone from 500k (in 1980) to ~150k today.

There has been a lot of pushback to PSR from politicians, shippers, workers, and regulators. Shippers argue regulators need to do more to protect them from fees the rails charge for being off schedule. With the exception of BNSF, the Class 1 railroads have all switched to PSR. In 2019, BNSF’s Executive Chairman, Matt Rose, argued that by switching to PSR, the rails were only inviting regulatory risk – implying the margin improvement was not worth it in the long run.

There are also arguments that PSR’s cost reduction focus has contributed to inefficient safety procedures. At some rails, mechanical staff (responsible for checking on the state of the trains) have been cut and their work has been handed over to conductors – who are already slim in number. Although, it should be noted that the number of train derailments peaked in 70s and has been on a decline ever since.

Competition

The closest competition to the rails are trucks, if you would consider them as such. Rail shipping is far more cost-effective, sustainable, and speed-efficient. For all the reasons above, it simply makes the most sense for industrial economy to focus on rail transport. The location of freight customers also tends to make them captive to the railroad operating beside them, as it would not be economically feasible to use any other mode of transport. The result of this, is better economics for the railroads and returns for the shareholder.

Capital Allocation & Returns

Although I have waxed lyrical about the competitive position of the big rails, they all still share one similarity – a relatively low return on invested capital. Despite being the most effective form of transport, rails do just require a lot of capital expenditures (even when minimal).

In the past two decades, there has been a focus on the shareholder at the rails. Recognizing their competitive barriers, the companies have taken on more debt to finance dividends & buybacks. The stability of their cash flows has made the decision that bit easier, returning 40%+ of free cash flow to shareholders.

In sum, using their century old barriers to entry, the railroad business looks to be economically attractive. There is decent earnings visibility, captive customers, and the ability to take on debt comfortably. This has led to railroads providing outsized returns for their shareholders through capital allocation strategies & improved operations in recent history.

Asides

(1) The rail industry has a key figure – operating ratio (1-EBIT Margin), personally not sure why EBIT margin doesn’t suffice… (2) Union Pacific bought Central Pacific, through their Southern Pacific acquisition in 1996 (3) Hunter Harrison’s effect on the railroads can’t be understated, serving as CEO at CN, CP, and CSX (4) The industry has no shortage of activist investor history: Ackman at CSX, Elliot Management at CN, and Soroban at UNP (5) Rail landownership has led to a number of different businesses sprouting from within the railroad companies (ex: SPRINT).

(6) The Credit Mobilier scandal (1865-69, exposed in 72′) highlighted the extent of corruption in the Gilded Age. Credit Mobilier was believed to be a construction contractor for Union Pacific, but was truly controlled by UNP’s management. The plot was simple, to bill UNP at rates above reality and thus the government (at the time subsidized UNP rail construction). Credit Mobilier shares were given to politicians (from Congress to the sitting VP) in exchange for silence, receiving dividends for embezzling state funds. After being exposed, a number of politicians would leave their post and Union Pacific was left on the brink of bankruptcy.

Discounting & Margins of Safety

The cost of equity as defined by Investopedia is “the rate of return an investor requires from an equity investment for it to be considered worth the risk”. The cost of equity is calculated as the sum of the risk free rate and the stock’s beta multiplied by the equity risk premium (see image below for the formula in full).

In valuing companies, you would typically use this formula along with the cost of debt to find the weighted average cost of capital, WACC. It is an immutable fact that the present value of a business is the future cash flows of said business discounted to today using an appropriate discount rate. The appropriate discount rate just so happens to be WACC in most cases.

I have a few problems with using WACC as a discount rate. I’ll explain why:

I am sure most people have heard that volatility is an ineffective measure of risk. I agree with this statement. I am of the opinion that the only way to measure business risk is to avoid numeration almost entirely. The only way to think of risk is to identify the innate risk of the business operations and the resulting probability of permanent capital impairment. To be succinct, I do not believe the cost of equity is of any use in discounting cash flows. Since all public equities have a positive current equity value, this means I cannot support a weighted average cost of capital either.

On the cost of debt…

Of the make up of WACC, the cost of debt is the more coherent of the two. It makes sense that all else held constant, incremental debt up to a point is beneficial to a firm’s value, as it decreases the WACC. This is because the interest payment on debt is tax deductible (avoiding taxes can be quite beneficial, just ask John Malone). But again, I don’t think the assigned cost of debt is all that useful in valuation. I’ll explain how I like to think of it down below:

Opportunity Cost

All economic decisions should be measured against ‘the next best alternative action’, the opportunity cost (as defined by the Core Economics textbook). The same textbook also defines the opportunity cost of capital to be: the amount of income an investor could have received by investing the unit of capital somewhere else. I think that is a perfect definition and the best way to think about discount rates. Every time you choose to deploy capital into a business or something else there is always the chance to refrain from doing so and just put it into a risk-free asset.

Add: When I mention risk-free rate (or asset) what I mean is the long-term yield on a government bond

I think the best measure of a discount rate is simply the prevailing risk free rate (or if abnormally low, an adjusted amount closer to the long-term average risk-free rate – being careful of attempting to predict future interest rates/yields…). By comparing the yields between your potential investment and the risk-free rate you are addressing the opportunity cost of capital. The investor should then be able to judge the margin of safety as the excess of a firm’s yield over that of the risk-free rate for the same length of time. I believe the surer the business the lower the excess on yield is needed is to be acted upon, the opposite holds. It is important to note that price paid per-share will undoubtedly have an impact on the return of the investment as it is the denominator of an earnings yield.

The reason terrific businesses can justify being bought at higher prices (consequently lower yields) is due to the durability of their earning power. Over the long-term, businesses that have durable advantages over competition will grow their earnings and yield. The best of businesses can justify narrower margins of safety but the examples of such businesses are far and few between.

Assumptions

I made a key assumption in writing this post that the investor is able to ‘confidently’ forecast future cash flows. If one is not confident of doing so, there is no point comparing the opportunity cost and they should just move on. Some would argue that you should adjust the discount rate higher to make up for the uncertainty or extra risk of the asset. This of course makes mathematical sense as it reduces the value of the uncertain future cash flows but not so much logical sense. The second you recognize your inability to ‘predict’ future cash flows should be where the operation stops.

An Important Reminder

A second assumption I made was the nature of government bonds being ‘risk-free’. Obviously, this is not always the case and depends on the currency/country the business deals in. In the event, that a government bond in the currency of interest is not risk-free, the investor needs to decide on what should be the minimum yield on their investment.

To quickly conclude, an opportunity cost of capital is the best representative of a discount rate. The margin of safety arises as the earnings yield of the business exceeds the opportunity cost of capital and the businesses whose returns are buoyed up by durable advantages require less a difference than their counterparts.

Book vs Intrinsic Value

In this post, I will look over the divergence in intrinsic and book value. This piece takes heavy inspiration from Warren Buffett’s 1994 Berkshire Hathaway Shareholder Letter.

The book value of a business is a number that is very easy to compute but it does have its limitations in use cases (best for banks & insurance). Unlike intrinsic value where it is impossible to calculate exactly and can be used for all businesses regardless of size or industry.

To clarify, I would define book value as the carrying value of the entire enterprise (share capital & retained earnings), which is the difference in total assets and total liabilities, its net worth. I would define intrinsic value as the discounted value of the cash distributable to owners throughout the course of the firm’s life.

The book and intrinsic values of a business can be very different. When a firm’s assets are due to produce little to no cash for owners in the future and the carrying value is more than liquidation value, the book value for the business will exceed the intrinsic value. On the other hand, when the carrying value of a firm’s assets are less than the cash benefits to owners in the future, the intrinsic value of the business exceeds the business’s book value.

In his letter to shareholders, Buffett uses the example of education (a form of investment) to explain the divergence of book & intrinsic value.

To get a figure for the intrinsic value of education, we would need to estimate the future earnings stream that a graduate would receive throughout the course of their lifetime and subtract that number by what they would’ve earned in their lifetime without a degree. The difference, discounted at the appropriate interest rate back to the day of graduation is the intrinsic economic value of education.

The cost of education should be thought of as the book value.

To evaluate whether or not the cost of education is worth it, prospectives should compare their book value to the intrinsic value of education. If the intrinsic value of education falls short of the book value, the student would not be getting their money’s worth and is better off getting a job than going to college. Some prospectives will find that their intrinsic value of education exceeds their book value, these people are far better off paying for their education and then getting employed. It is important to note that this calculation ignores the non-economic value of education that is a key factor in the decision making process for many.

In a more practical example, Buffett uses the example of Scott Fetzer (1986-1994), a Berkshire subsidiary. Acquired in 86′ Berkshire paid $315 million, a $142.6 million premium to book value. Back in the 90s, goodwill would be amortized (was changed in 01′ w/ some exceptions made in 14′), and was in the case of Scott Fetzer & Berkshire. In this example, Scott Fetzer’s carrying value on Berkshire’s books had shrunk down to $90.7 million but earnings had just short of doubled ($40.3M > $79.3M). Whilst the book value of Scott Fetzer was shrinking, the intrinsic value of the business was growing. The amortization costs of Scott Fetzer reduced Berkshire’s net worth & earnings but in truth, the intrinsic value growth strengthened the Berkshire enterprise.

Source

In some cases, book value is a fair and useful indicator of business performance but it cannot be made out to be a substitute for intrinsic value. The calculation of intrinsic value is completely different to that of book value and far less precise. Book value is faithful to historical value, while intrinsic value fixates on future output. When evaluating possible investment opportunities, it is almost always appropriate to disregard book value for intrinsic value.

The Importance of Return on Capital

High price to earnings ratios tend to be associated with expensive share prices. But is this true? When looking at a P/E ratio in isolation high multiples don’t seem all that appealing and may result in subpar investment returns. When comparing a large and diversified list of stocks, low P/E names tend to outperform higher P/E stocks on average. But on an individual level, the fundamental makeup of companies is what should truly decide a firm’s per-share price relative to its current earning power. The price to earnings ratio doesn’t have much to do with valuation other than providing a hint as to when cash may flow into the business.

The value of a company rests on the discounted value of future cash flows generated by the business. This figure is completely independent to TTM earnings numbers and the price to earnings ratio of a stock. A more appropriate metric to look for in a business is the return on invested capital. The importance of maintaining a high ROIC is best summed up by Charlie Munger when he said:

In the short term, the per-share price of a stock can fluctuate erratically but as an investor continues to hold their shares over the long term it will match the internal returns of the business. As for the business, the best way to increase the per share intrinsic value of the firm is to retain a substantial percent of their earnings and reinvest those earnings at a high rate of return (if possible). The very few businesses that can guarantee high returns on incremental capital over an extended period will undoubtedly outperform the market. These types of businesses require durable competitive advantages to achieve such results. There are only a handful of businesses that fit this profile – many will promise these returns but are unlikely to realize them.

An example of one of these businesses is Skyworks Solutions. Let’s see how an investment in the business would’ve fared from 2011-2021.

In 2010, Skyworks Solutions earned $137 million in after-tax profits on $613 million of capital (minus cash, cash equivalents, goodwill, and intangibles), a return of 22%.

Fast forward to 2021, Skyworks then earned $1.49 billion in after-tax profits on $3.7 billion of capital, a return of 40.5%.

Over the 10 years, profits have increased by $1.36 billion while the company has invested an additional $3.1 billion of capital. Therefore, Skyworks’ return on additional capital employed over the 10-year period is a whopping 44%. Over the period, you can estimate that Skyworks reinvested about 42% of its earnings. By dividing the $3.1 billion of additional capital with the cumulative earnings of the period you get an estimate of the percentage of earnings reinvested into the business. Meaning for every $100 of earnings generated by Skyworks, $42 was reinvested in the business and $58 was distributed back to shareholders as dividends and/or share repurchases.

The value of the business should also over time compound at the rate at which the product of the percent of earnings reinvested and the firm’s return on invested capital equals. For Skyworks that would be a per-share compounded growth rate of 18.5% (.44*.42) and higher due to buybacks and dividends.  

Skyworks Solutions stock closed on the 31st of December 2010 at a price of $28.63. 10 years later, on the same day, the stock closed at $152.88, a CAGR of 18.24% (excluding dividends), not too far off the estimated per-share growth rate using the return on incremental invested capital. Unless there is a substantial expansion in multiples, businesses with low returns on capital will see their shares match their rate and provide unsatisfactory results for shareholders.

The best kind of businesses can reinvest a substantial amount of their earnings at high rates of return for long periods of time until large numbers eventually drag down results (like the DJ Khaled album, Suffering from Success). Another great business is one that provides high rates of return but only on a small portion of reinvested earnings (a Coca-Cola or See’s Candies for example). These businesses should end up sending shareholders/owners most of their earnings or risk destroying shareholder value as the capital can no longer be deployed intelligently. By sending excess earnings to shareholders, the owners can reinvest that capital in other enterprises with more enticing opportunities. The worst businesses on the other hand require large amounts of capital to get a return that is just satisfactory (airlines). To quote Richard Branson, “the fastest way to become a millionaire in the airline business is to start out as a billionaire”.

Many other alterations can be made to find the ‘right’ numbers to calculate a firm’s return on capital. But the 2 types of businesses where owners are treated to exceptional results are very rare to find. This key metric in my opinion is more likely to tell you about the value of a business as opposed to a firm’s price to earnings ratio. The value of a business relies on future assumptions of cash flows not past earnings.

For more reading on the topic: https://www.berkshirehathaway.com/letters/1992.html. https://sabercapitalmgt.com/calculating-the-return-on-incremental-capital-investments/

Activision & Arbitrage

On January 18, 2022, Microsoft (NASDAQ: MSFT) announced their plans to acquire Activision Blizzard (NASDAQ: ATVI) for $95.00 per share, an all cash deal valued at $68.7 billion, inclusive of Activision Blizzard’s net cash. Should the deal close Microsoft Gaming would become the 3rd largest video game provider by revenue (behind Tencent & Sony). Microsoft hopes to close this deal by June 30, 2023, its fiscal year end. This acquisition serves as a chance for Microsoft to continue growing its gaming business on PCs, mobile phones, and consoles. However, Activision shares currently sit at $72.60 per share, representing a 30.85% upside should the deal close. Interested in this opportunity, I’ve decided to write here some of what is known of the deal and will attempt to judge the probability of the deal closing.

The Target

Activision Blizzard is one of the world’s largest video gaming publishing companies. The company owns some of the world’s most well known franchises in gaming. The Blizzard Studio houses: “Call of Duty”, “Overwatch”, “World of Warcraft”, “Diablo”, and many more. Additionally, the King Studio has “Candy Crush” and more mobile games to its name. Prior to the announcement of the deal at the turn of the year, shares saw an intra-year drawdown of over 40% in 2021 from a peak at $103 per-share. This drop was largely due to lawsuits filed against the company alleging sexual misconduct committed by executives. Over the years, Activision has been berated for its handling of sexual harassment allegations and its lack of change to remedy the problems within its workplace.

Source: Microsoft Acquisition Slide Presentation

Come January, Activision shareholders quickly saw a turn in their fortunes when Microsoft announced its planned acquisition of the company for $95.00 per-share. But as I introduced earlier, shares have not climbed to that level representing the risk, mostly legal, of the deal failing to go through. I will now go over what UK & EU regulators are saying about the deal.

Legal Worries

According to Reuters, the European Commission’s biggest worry with this deal is whether Microsoft would be incentivized to block competitors off from Activision’s array of games and if that should occur, if there would be enough suppliers in the market afterwards. The EU regulators have already probed competition to find out if the acquisition would give Microsoft a competitive advantage in publishing & distribution of games across all platforms, from the user data they would receive. Game developers & publishers are also being considered as to how a deal would affect their bargaining power to sell games on Xbox and through the Game Pass (Microsoft’s Cloud Gaming subscription service). Other regulatory worries surround the “Call of Duty” franchise and potential effects of adding Activision to Windows OS.

The UK’s Competition and Market’s Authority (CMA) have continued their in-depth probe into the acquisition also being weary of the what could occur should Microsoft block rivals from Activision’s library. An area of great concern for the CMA is in the nascent cloud gaming industry, where the addition of Activision could damage competition for services.

It seems most authorities are only considering their local industry dynamics, which may prove to be a headache for Microsoft to get the deal over the line, as Tencent and other competitors may have less of a hold on certain markets.

Note: I have excluded the FTC from this discussion, as they tend to be rather toothless when it comes to stopping these deals. However, that could always change…

The Response

It seems to me that the most common concern behind the scrutiny of the transaction is the fear of Microsoft turning Activision’s library into Xbox exclusives entirely. But will this fear prove to stop the deal or is there evidence that the regulators will turn a blind eye to this. We already have precedent of Microsoft acquiring game publishers and continuing to make the games available on all platforms (also making a few exclusive, in fairness). On March 9, 2021, Microsoft finalized the acquisition of Bethesda Softworks (developer of Fallout & Doom) for $7 billion. Fast forward, a year from the finalization of the deal, Bethesda plans to release Fallout 4 in 2023 across all platforms, including close competition at Sony. Besides the size of this transaction what real change is there between the purchase of Activision and that of Bethesda? Here are a few words from the EU Commission after approving the Bethesda acquisition:

“The Commission concluded that the proposed acquisition would raise no competition concerns, given the combined entity’s limited market position upstream and the presence of strong downstream competitors in the distribution of video games” Source

I do not see any reason why regulators should fear this acquisition based on their prior approval of a similar transaction. The only difference discernible to me is the size of the deal, but when compared to the big two (in gaming revenues): Tencent & Sony, Microsoft + Activision only closes the gap in revenues and would still be around $2 billion short of Sony in 2nd place. Additionally, it is important to note that gaming has been a long continued trend of supporting cross-platform function. I do not see why Microsoft would fight against this trend, when previous acquisitions show it hasn’t done so and risk alienating potential audiences from the games they would develop themselves. Candy Crush, Call of Duty, and World of Warcraft made up 82% of Blizzard’s revenue for the fiscal year 2021, it is hard to imagine why Microsoft would make these games exclusive to its platform given the growth in cross-platform gaming. To me, it would be a misstep by Microsoft to turn the Activision library into Xbox exclusives and it would not make sense for them to do so given the rising popularity of cross-platform gaming.

The deal has already passed through regulators in Brazil & Saudi Arabia. What I found to be most interesting is what Brazil’s Administration Council for Economic Defense (CADE) had to say about the deal and Sony. Brazilian regulators wrote in response to Sony complaints:

“Furthermore, it is important to highlight that the central objective of CADE’s activities is the protection of competition as a means of promoting the well-being of Brazilian consumers, and not the defense of the particular interests of specific competitors” Source

The comments by Brazilian regulators are another reminder that as of current, this merger would only result in closer competition between Microsoft, Sony, and Tencent in gaming. Sony feeling most threatened by the deal due to the perks of their existing deal (ends in 2024) with Activision over the Call of Duty franchise have been the most outspoken against the deal going through. Microsoft has continued to reassure regulators of their commitment to keep the CoD franchise on all platforms past the 2024 deal end & release the CoD games at the same time on all platforms. I take the comments by the Brazilian regulators as another reminder of who is atop the gaming industry and how the Microsoft-Activision deal is not what it seems like at first glance.

The Deal

(1) Deal Likelihood is calculated using the current spread on the deal ($22.40) versus the total accretion of the deal from the market clean price ($35.63). The market’s assessment of likelihood should be the ratio of what is left to be accreted over the total accretion possible, which is 63% $(22.40/35.63).

(2) Clean Price calculated using pre-deal per-share price compared to the decline of the S&P 500 since (17.75%) using the target company’s beta, 0.52 (5yr, monthly). The clean price represents what the target company would be trading at today had there not been an offer tabled.

In the image above, I’ve presented the current situation of this merger and the potential gains/losses for an arbitrageur. It is obviously difficult to know the exact likelihood of the deal passing without having any strong legal knowledge in the matter. Microsoft has a terrific record of seeing out past acquisitions which they should hope to see continue here. The downside as implied by the calculated clean price would be a drop of 22.28%, should the deal fail to close. So, although the gain is handsome, the downside is not too appealing. In my mind, I see this deal following through in the UK, EU, and US for the same reason it has in Brazil & Saudi. Microsoft’s purchase of Activision, although large would result only in the closing of the gap in revenues from the 2 frontrunners in the industry, Sony & Tencent. So, I think the market’s hesitancy over this deal presents an opportunity that doesn’t come often. Thankfully, we won’t have to wait too long to learn more about this deal as we await a preliminary decision (either further probe by 90 days or accept) by EU antitrust regulators on November 8, 2022. Other antitrust regulators are still investigating with decisions to be made in the short future (UK’s CMA phase 2 investigation deadline is on March 1, 2023).

Well, those were just my thoughts on the deal. You can read more about the merger from these sources: https://www.reuters.com/technology/eu-wants-know-if-microsoft-will-block-rivals-after-activision-deal-2022-10-06/ https://investor.activision.com/static-files/180f309f-89e2-4fb8-a98d-b527edfdaf46 https://news.microsoft.com/2022/01/18/microsoft-to-acquire-activision-blizzard-to-bring-the-joy-and-community-of-gaming-to-everyone-across-every-device/ https://techcrunch.com/2022/10/13/activision-blizzard-is-once-again-being-sued-for-sexual-harassment/ https://www.cnet.com/tech/gaming/eu-scrutinizes-microsoft-acquisition-of-activision-blizzard/ https://xboxera.com/2022/10/05/brazil-becomes-the-second-country-to-approve-microsofts-acquisition-of-activision-blizzard-with-no-restrictions-xbox-activision/

Inflation & The Equity Investor

In light of the sustained high inflation we are seeing today, I thought it would be great to read over and summarize the writing of Warren Buffett from his experience with high levels of inflation in the 70s. In 1977, Buffett wrote for Fortune magazine on “How Inflation Swindles the Equity Investor”, a time where most believed equity investing was a ‘hedge’ against inflation. No one knows how this period of inflation will unfold today but it should be interesting to learn what Buffett made of a period where inflation ruled the land.

Effects of Inflation

Buffett begins by explaining how there is no secret that stocks and bonds perform poorly in inflationary environments. With bonds, it is axiomatic that a fixed income investment will perform poorly when the dollar value in which it is denominated in continues to deteriorate. Back then, many had believed stocks to be a hedge against inflation, which proved to be misguided. The reason as Buffett puts it, at their economic substance, a stock is very similar to a bond. The main difference between bonds and stock is the unpredictability of their cash flows, a stock varies from year to year, a bond has set coupon payments.

Through the 50s, the market had an annual average year-end return on equity of 12.8%. Into the 60s &70s the average sat at around 10.8%. While the return on equity could jump around yearly, over long periods of time it was quite stable, this is where Buffett believes it would be okay to refer to corporate earnings as an “equity coupon”. A key difference between bonds and stock is when the cash ins received by the investor, usually a bond coupon is handed straight to the investor to reinvest wherever they see fit. As for stocks, earnings withheld are reinvested at whatever rates the company happens to earn. Part of this earnings can be paid out in dividends, the rest will match the company’s rate of return. This ability to reinvest earnings at high rates allowed for investors to buy interests in enterprises for a price at book value, which was far below the actual value of the business.

When inflation rises and interest rates follow, the equity return starts to be looked at differently by investors. Although, Buffett claims that over the long term, the equity coupon is more or less fixed, the short term fluctuations can sway investor attitude about the future far more than warranted. Since stocks have no maturity and carry additional risk to bonds, investors need a return above that of a bond and when this spreads narrows too much, the exit is the option for most investors.

The Inflation Tax

Further into the article, Buffett breaks down the mathematics of the inflation tax. Had an investor been earning 12% pretax they were expected to earn 7% aftertax using tax rates from that time. When inflation runs at or above that 7% rate, the real return becomes zero. Another example Buffett uses, is a widow earning 5% on her savings. Had the widow been taxed 100% on interest income she would lose her 5%, had there been no interest tax but inflation ran at 5% she would lose her interest income all the same. In both cases the widow walks out with no real income.

Conclusion

In sum, inflation works as a silent tax that swindles everyone including the equity investor. The effect on inflation can affect aftertax returns. When you boil it down, investing at its core is the commitment to give out your purchasing power today in the hopes of increasing your purchasing power later a much higher rate. Periods of sustained high inflation are not able to guarantee the return an investor receives after frictional costs will actually see them make real returns. So it should also follow, that periods of deflation are more favourable to equity investors, where the real return on their investments would increase due to future higher purchasing power of their dollar invested. Many people attempt to guess the inflation or interest numbers, and work off that, but those numbers move in a way that could never be predicted, not even by those with access to the necessary information. Inflation is a tax investors must familiarise themselves with and beat or they end up earning zero real returns if the rate of inflation is high enough.

You can read Buffett’s article here: http://csinvesting.org/wp-content/uploads/2017/04/Inflation-Swindles-the-Equity-Investor.pdf

Economics of Google

Alphabet Inc, the conglomerate that owns Google and its subsidiaries is one of the most fascinating companies in the world. In this post, I will focus more on the Google business of Alphabet Inc.

Google is divided into 2 main segments: Google Services & Google Cloud. Alphabet continues to innovate in the technology space, spending over $100 billion in R&D over the past 5 years, making significant commitments in AI.

Google Services

The core products/platforms in the services’ segment include: ads, Android, Chrome, Gmail, Google Drive, Google Maps, Google Photos, Google Play, Search, and YouTube.

As mobile adoption continues, people consume more videos, books, games, music, and ads. The company continues to invest in both the Android & Chrome operating systems in a bid to form a tightly knit family of hardware devices as well. Alphabet also owns the Pixel Phones, Fitbit, and Google Nest. The Services segment generates revenue mostly through advertisements (performance & brand). Performance advertising involves creation of ads that users will click on, to lead them to the advertisers. Brand advertising involves helping specific brand advertisers reach their specified audience through text, video, or image across various devices. Google Services also has other sources of non-advertisement revenues. Google Play generates revenue through app sales & in-app purchases of content from the Play Store. The hardware produced by Google (ex: Fitbit, Nest, Pixel) all generate sales from units sold. YouTube subscription services (ex: YouTube Premium, YouTube TV) also provide a source of non-advertising revenue.

Google Cloud

The core products in the cloud segment include: Google Cloud Platform & Google Workspace.

The main source of revenue from the Cloud Platform comes from infrastructure, platform, and other services. Workspace generates revenues mainly from enterprises using cloud-based collaboration tools (ex: Meet, Drive, Calendar, Docs, Gmail).

Google’s Moat

I believe Google’s greatest strength is in its customer captivity – most prevalent in the largest unit of the business, Google Search. I cannot think of a time in my recent memory where I’ve seen or used a different search engine to Google. I believe this is the same for the majority of others. The competitors in this field are shrimp compared to the whale that is Google Search, and the economics of Search shows it. In the video content space, YouTube also remains king. There is fierce competition in this arena, as you compete for consumer attention. However, YouTube unlike a Netflix or Disney+ does not need to focus on creating its own content, when YouTubers do the expensive content creation for them – a wonderful system for both parties involved. The other main competitors for attention come from social media (ex: Instagram, TikTok) have shown that in the case of long-form content they still cannot compete with YouTube. In short videos, where TikTok rules, Google & Facebook have both introduced their own competitors which are growing at healthy rates to perhaps stifle TikTok’s popularity. It is too soon to say who will end up winning the fight of the short form content platforms, but the already concluded battle of long form content platforms is being dominated by Google’s YouTube. Another unit worth mentioning is Alphabet’s Android. The mobile OS has a 47.5% market share of mobile OS as of 2018 (IOS behind with 41.9%) allowing Alphabet to recoup a large pot for themselves from the Play Store. This shared dominance with IOS is unlikely to change with new entrants in a field where consumers are hesitant to change. Alphabet’s position in the markets it finds itself allows the company to produce above average returns on capital. I mentioned that they spend heavily on R&D earlier on, it is important to remember that the nature of most of its business does not require heavy CAPEX. Alphabet’s core business allows for great economics where the shareholders can generate great wealth for themselves through ordinary business operations, a truly remarkable enterprise.